


What to know:
- Celestia (TIA) shows a potential breakout as price consolidates near key resistance levels with improving bullish momentum
- Technical indicators signal strength with higher lows, rising MACD momentum, and sustained buying pressure
- Traders are closely watching breakout confirmation levels that could determine continuation toward the $2.70 level

Celestia (TIA) shows a potential breakout in price action after consolidation, but it still faces key resistance that will decide the next move for TIA price. Technical indicators remain bullish with improving momentum and higher lows. Derivatives show mixed sentiment as trading activity rises while open positions decline. According to CoinMarketCap, TIA is trading at $0.4520 with a daily decline of

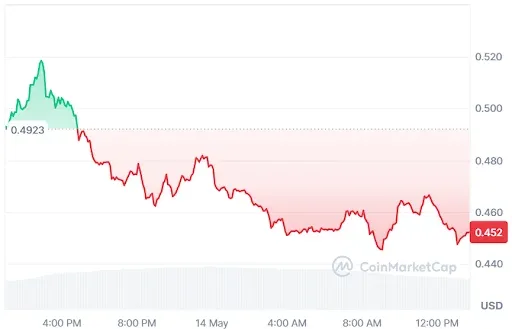
Source: CoinMarketCap
TIA Derivative Data Point to a Cautious Outlook
According to Coinglass, the TIA open interest decreased by 11.48%, standing at $74.42 million, while trading volume increased by 13.93% to $292.87 million, indicating mixed market signals with reduced outstanding positions but stronger transactional activity across derivatives.


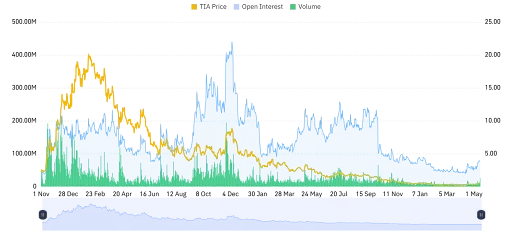
Source: Coinglass
Rising trading volume suggests increased participation and liquidity, reflecting heightened market engagement from traders reacting to recent price movements and volatility trends, even as overall positioning contracts slightly, signaling short term activity strength despite weakening open interest across derivatives markets.
Also Read: Celestia (TIA) Price Trend Suggests Gradual Reversal Toward $0.40 Breakout
TIA Price Breakout Signals Possible Rally Toward $2.70
Furthermore, the crypto analyst ZAYK Charts revealed that the TIA price seems to be positioning itself for a potential breakout on the 1-day chart after several weeks of trading in a consolidating manner.
It looks like buying pressure is slowly overcoming resistance. In case of the persistence of this development with strong volume support, it will most probably herald the start of a new trend upward for TIA price.
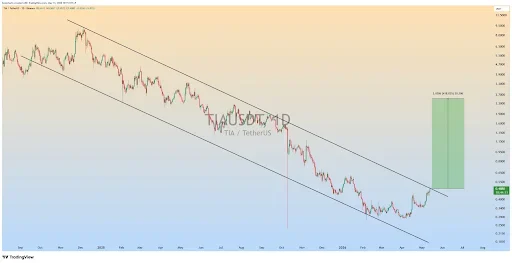

Source: ZAYK Charts’ X Post
If the breakout is sustained, the TIA price might move towards the $2.70 level, where resistance may be expected.
But the importance of confirmation cannot be underestimated, since a failed breakout would quickly reverse the price back into its previous trading range. In the coming days, it can be seen how well the rally of the TIA price will sustain itself.
TIA Technical Indicators Shows a BUllish Outlook
According to TradingView, the price movements in TIA have rebounded from the lows seen in April to create an ascending trend with higher lows.
The TIA price of the asset is currently at $0.45349, indicating that the token is showing strong positive movement, trading within the top band of the Bollinger band. Despite reaching a peak recently, there is still some resistance to selling.
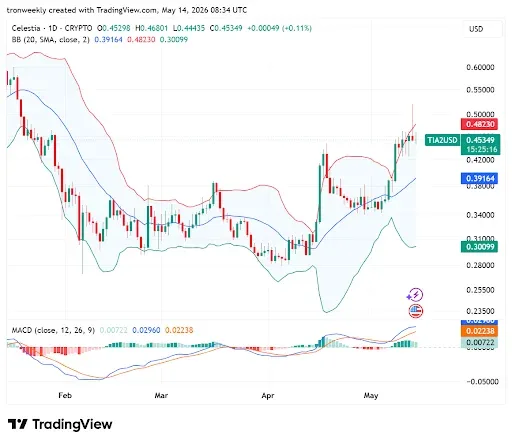

Source: TradingView
The technicals also support the optimistic outlook. The MACD lines enter positive territory, and there is continued buying interest. The token is experiencing heightened volatility, which shows in the widening Bollinger Bands.
The traders need to watch the $0.48230 level of resistance carefully, as a breach or a retreat to $0.39164 could set the direction for future price action.
Also Read: Celestia Price Outlook: TIA Price Breakout Targets a Potential 300–400% Rally

Be the first to comment