



What to know:
- QNT shows a bullish setup near resistance with higher lows and tightening Bollinger Bands, signaling breakout potential.
- MACD bullish crossover confirms rising buying pressure and stronger upward momentum in QNT.
- Analysts see a possible 50–60% rally toward $120 if QNT breaks the key resistance trendline.

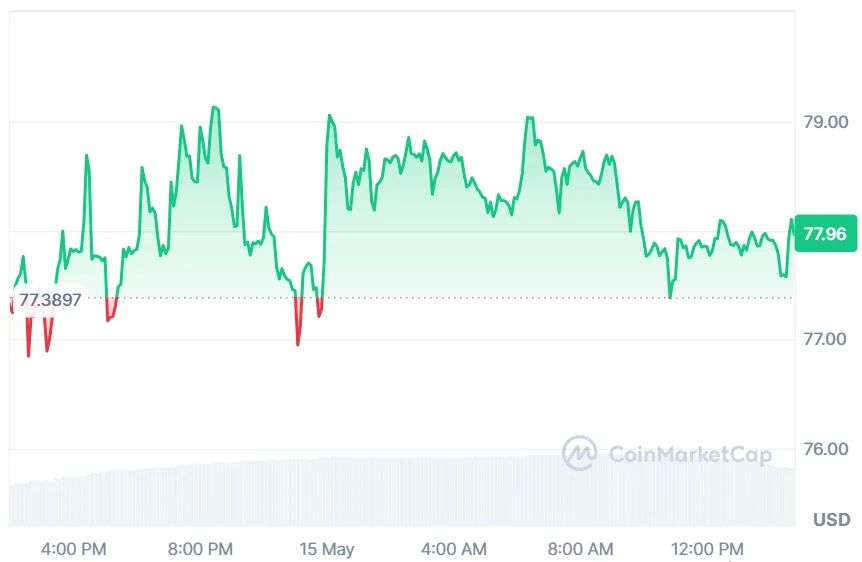
Quant (QNT) shows strengthening price action near key resistance with higher lows, supported by bullish technical indicators like MACD crossover and tightening Bollinger Bands, while rising open interest and volume reflect increasing derivatives participation and growing market confidence, suggesting potential breakout momentum for the QNT price. According to CoinMarketCap, QNT is trading at $77.95 with a daily gain of 1.14%.

Source: CoinMarketCap
QNT Derivative Data Point to Strengthening Momentum
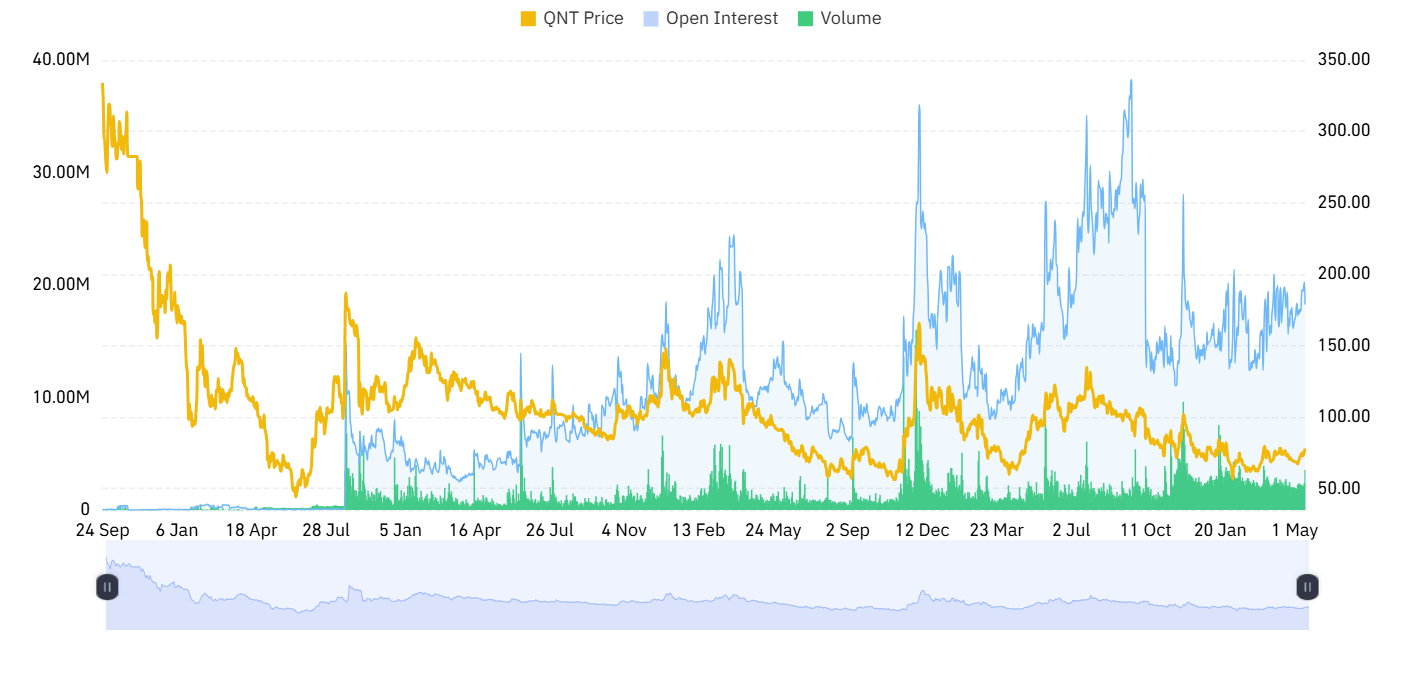
According to Coinglass, the QNT open interest rose by 7.81%, reaching $18.69 million, suggesting growing positions in the market, increased derivative engagement, and sustained trader confidence, while reflecting expanding exposure and potential momentum building as participants maintain or add contracts.


Source: Coinglass
Furthermore, volume increased by 21.28%, reaching $42.43 million, indicating stronger trading activity and market participation, reflecting heightened investor interest, improved liquidity conditions, and potentially increased volatility as traders engage more actively in buying and selling.
Also Read: Quant (QNT) Price Analysis: Resistance Break Could Unlock Move Toward $115
QNT Price Eyes 60% Rally After Key Resistance Test
Furthermore, the crypto analyst Clifton Fx revealed that the QNT price is now facing an important turning point on its daily chart, as the price approaches the support of the declining trend line that has consistently held its gains in check.
What is revealed on the chart is that the QNT price has been in consolidation mode as it forms higher lows in anticipation of a breakout move.

Source: Clifton Fx’s X Post
In the event that the breakout comes on the back of a highly charged candle coupled with a close above resistance levels, the probability is high for a structural shift towards the bullish side of the market.
Under these circumstances, the upside target will be between 50% and 60%, putting the QNT price at around $120. This price will be within areas of previous supply, where there is potential for increased volatility and profit-taking.
QNT Technical Indicators Show Improving Strength
According to TradingView, the QNT price is currently in recovery mode, where it approaches the upper Bollinger Band at $78.00.
Following its rebound from the 20-day moving average (MA) at $71.55, QNT is rising to higher lows. The rise in the QNT price indicates that it will eventually make its way into the resistance levels of April.

Source: TradingView
Momentum within the technical analysis has been confirmed by the MACD indicator. The blue line of MACD is now moving above the orange line, indicating a bullish crossover.
At the same time, the histogram is now turning green and expanding, indicating that buyers have increased their strength, possibly leading to a breakout.
This article contains market analysis and price predictions. These are not guarantees. Crypto markets are volatile. Always DYOR. Not financial advice.
Also Read: Quant (QNT) Stabilizes at $70 Before Possible $260 Expansion Wave


Be the first to comment