


What to know:
- Ethereum price weakens in the short term as selling pressure increases and bullish momentum fades across the market.
- Indicators such as RSI below 50 and bearish MACD signal continued cooling momentum and rising downside risk.
- Long-term outlook remains bullish, with accumulation zone seen near $2,000–$1,500 and targets up to $5,000–$15,000.

Ethereum price is under pressure in the short run due to increased selling and reduced momentum. Buying strength continues to fade even as some long-term perspectives see this area as a possible area for accumulation. It is time to keep an eye on critical support areas.
At the time of writing, Ethereum is trading at $2,226.86, with a 24-hour trading volume of $33.17 billion and a market capitalization of $268.45 billion. Over the last 24 hours, the Ethereum price has dropped by 3.74%, reflecting growing weakness in near-term buying strength across the market.
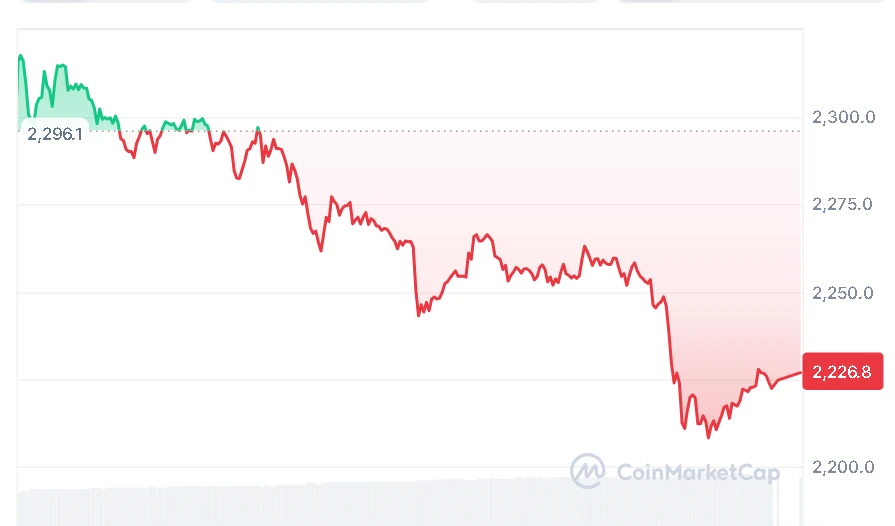

Source: CoinMarketCap

Also Read | Ethereum Price Holds Above $2,300 as Institutional Demand Grows
Ethereum Price Signals Weak Short-Term Control
On May 15, 2026, a crypto analyst, Crypto Patel, referred to the Ethereum rainbow chart, stating that the Ethereum price currently resides in what he terms as “a cheap zone.” The analyst explained that this is usually the position that is associated with fear on the part of many investors.
And according to Patel, the Ethereum price was in this range only a couple of times previously. In both instances, the price action of ETH shifted towards the “take profit” range, which takes place roughly 18 months after an upward cycle starts.
His approach is to continue his accumulation process as long as the $2,000–$1,500 band remains intact. In case the price of Ethereum falls below this level, his choice will be slow accumulation rather than an emotional response. The future targets for the Ethereum price are set at $5,000, $10,000, and $15,000.
Momentum Indicators Show Cooling Ethereum Price Strength
Despite the long-term perspective, the short-term indications show that the ETH price is weakening. The Relative Strength Index indicator fell to 43.22, breaking through the crucial resistance at the 50 mark, indicating the decreasing buying interest while sellers have started becoming dominant.

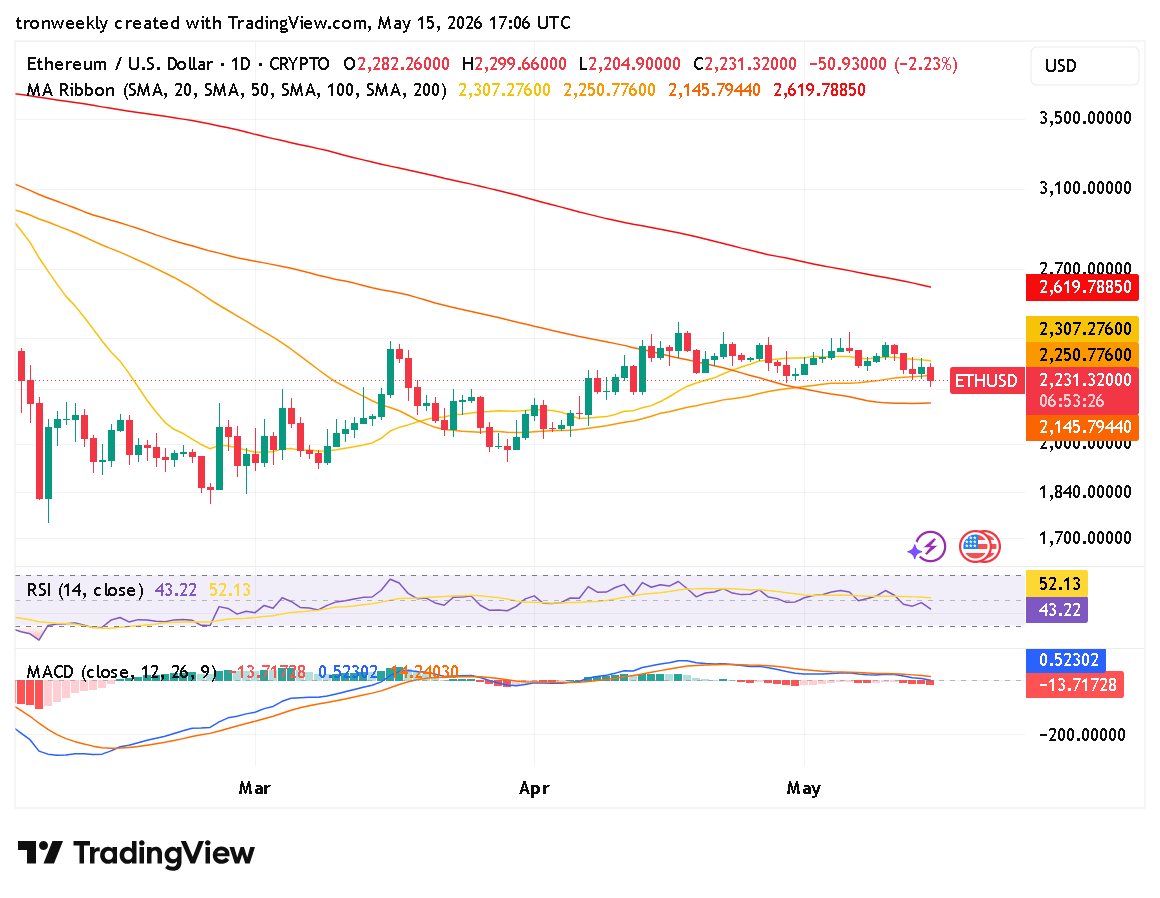
Source: TradingView
MACD technical analysis is further confirmation of weak momentum. The MACD line is currently at -13.71, trading below the signal line of 0.52, and the histogram has now turned red. The change indicates weakening upside momentum for the Ethereum price and increased risks of declines ahead.
In case the trend persists, price action on Ethereum is likely to approach the 100-day MA near $2,145 as an important level for bulls to defend their position.
This article contains market analysis and price predictions. These are not guarantees. Crypto markets are volatile. Always DYOR. Not financial advice.
Also Read | SHIB Price Analysis: Falling Wedge Breakout Hints at 6x Move to $0.000030

Be the first to comment