


What to know:
- Aptos (APT) shows early bullish reversal signs after sweeping sell-side liquidity and holding support near $0.95.
- Market structure suggests demand absorption as buyers regain control above a key order block.
- A daily close below $0.840 would invalidate the bullish setup and confirm breakdown risk.

Aptos (APT) shows a potential bullish reversal after sweeping sell-side liquidity and stabilizing at a key higher-timeframe support zone. Buyers may be absorbing pressure, suggesting possible upward continuation for the Aptos price if demand holds. However, momentum indicators remain weak, and short-term selling pressure is still present. According to CoinMarketCap, APT is trading at $0.9550 with a daily decline of 3.67%.
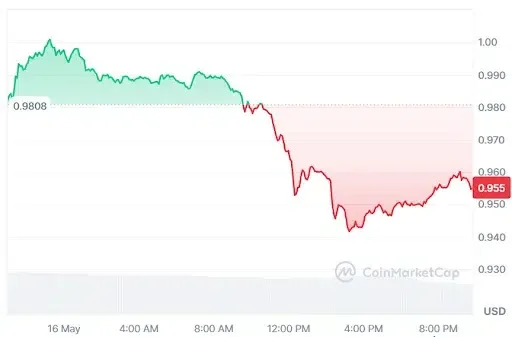

Source: CoinMarketCap
Also Read: Aptos Adds KRW1 Stablecoin Through BDACS Partnership

Aptos Price Setup Signals Potential Bullish Reversal
Furthermore, the crypto analyst Crypto Patel pointed out that the Aptos price is showing a potential bullish shift after sweeping sell-side liquidity and reacting from a higher-timeframe daily order block.
This move suggests a possible market reset where downside liquidity was cleared before buyers stepped in. The structure now hints at demand absorption, with price stabilizing inside a key HTF support zone.
The technical outlook remains constructive as liquidity below has been largely taken, while upside buy-side liquidity remains unfilled above the current price.
If the demand zone holds, APT could continue building momentum toward higher resistance areas. Market structure on the higher timeframe still favors continuation, provided buyers maintain control within the order block.
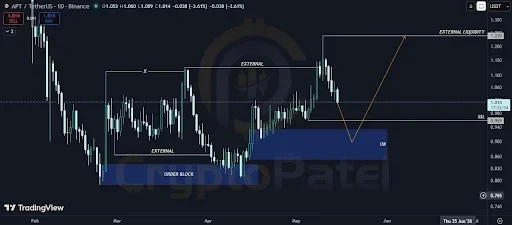

Source: Crypto Patel’s X Post
Potential targets for the Aptos price can be seen at $1.12 and $1.239, with liquidity being expected here. However, a close below $0.840 on a daily basis will negate any bullish scenario due to a breakdown in the demand pattern. Players are still waiting for confirmation to go long toward higher liquidity outside the range.
Technical Indicators Point to Cautious Optimism
According to TradingView, the APT price exhibits an unusually volatile pattern. From its initial low of about $0.79, it rose to hit a high range, then pulled back to form a double bottom.
The impressive rise in May helped the Aptos price to approach $1.20, but the immediate and successive daily retracement of prices saw it decline to $0.9542.
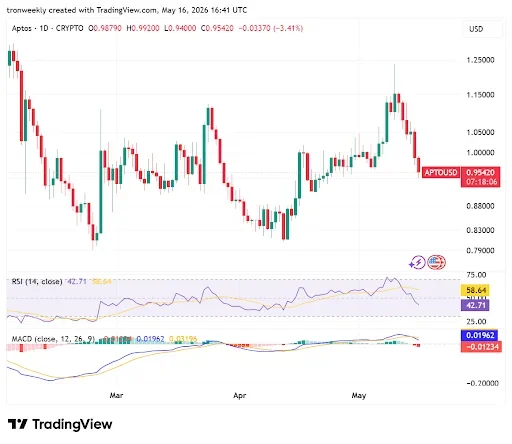

Source: TradingView
In addition to the decline in the Aptos price, there are fast changes taking place on the indicators with a rapid reduction in the bullish strength.
The RSI is falling sharply to 42.71 from above the moving average. The MACD line has also crossed below the signal line, thus generating the red histogram indicating selling strength.
This article contains market analysis and price predictions. These are not guarantees. Crypto markets are volatile. Always DYOR. Not financial advice.
Also Read: Aptos (APT) Price Forecast: KRW1 Integration Boosts Bullish Case Toward $1.24

Be the first to comment