


What to know:
- SUI is consolidating after a strong rally, with key support under watch as traders assess the next move.
- RSI cooled from overbought to neutral, while a bearish MACD crossover signals short-term weakness.
- Declining volume and open interest suggest lower participation and a temporary slowdown in bullish activity.
- Holding support could trigger a rebound toward $1.20–$1.40, keeping the broader uptrend intact.

SUI price is pulling back after a strong rally, testing key support while the uptrend remains intact. RSI cooled to neutral, and MACD turned bearish, showing short-term weakness. Additionally, lower volume and open interest also indicate reduced participation and a likely consolidation phase.
At the time of writing, SUI is trading at $1.06 with a 24-hour trading volume of $369.72 million and a market capitalization of $4.26 billion. Despite the expectations for a bullish reversal, the SUI price remained in a neutral phase over the last 24 hours.

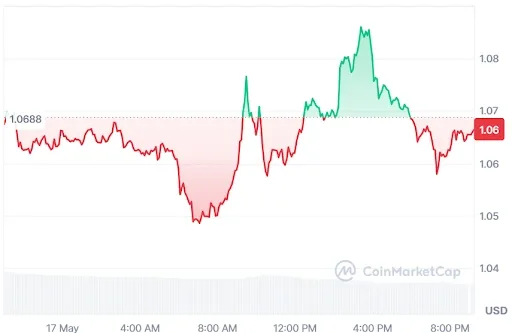
Source: CoinMarketCap

SUI Support Test Could Trigger Renewed Momentum
The crypto analyst BitGuru pointed out that SUI is pulling back after a strong bullish rally, easing into a key support zone as the market cools and traders take profits.
The SUI price still maintains a broader uptrend structure, with buyers closely monitoring this area where demand previously stepped in and reversed selling pressure during earlier consolidation phases.

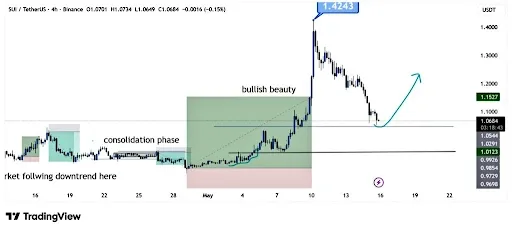
Source: TradingView
If this support level holds, momentum could quickly return, potentially driving a renewed upside move for the SUI price as buyers regain control.
A successful defense may open the path toward the 1.20–1.40 range, where prior resistance sits. However, losing this zone could extend the correction, making it a critical decision point for near-term direction.
Also Read: SUI Price Breakout Holds: Bulls Eye $4.20 Target After Pullback Signal
Momentum Indicators Support Cautious Optimism
The momentum indicators also support this cautious price structure. According to TradingView, RSI (14) switches from a bullish phase to a bearish phase due to the recent downward spike in the SUI price.
The purple RSI indicator has dropped from its overbought level of 80 to close at 51.54, below the yellow moving average of 62.98. This sharp fall may indicate that the bulls are losing steam.

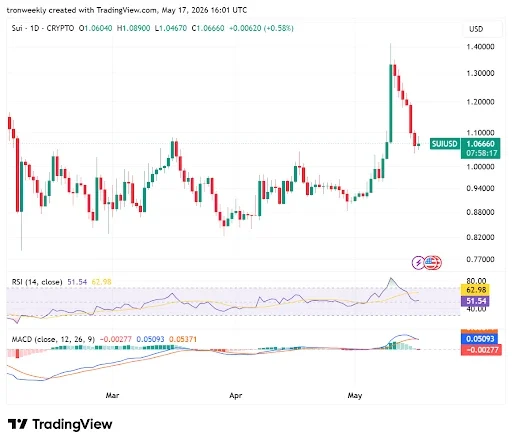
Source: TradingView
Meanwhile, the MACD indicator cements the bearish turn by generating a fresh bearish crossover. The blue line moves below the orange line, while the bars on the histogram turn red and contract towards zero.
Such an arrangement indicates that short-term sellers control market activity and prevent the SUI price from moving upwards.
SUI Derivative Data Point to Mixed Outlook
Furthermore, derivative data also support the consolidation phase; the SUI open interest fell by 0.35% to $685.19 million, implying that there is a slight reduction in the number of derivative instruments in place. Looking at the wider context of the recent trading trend, it means that traders are being conservative and reducing their position sizes.


Source: Coinglass
The trading volume fell by 29.08% to close at $752.62 million. The fall indicates low liquidity and weak momentum in the market, suggesting that the traders are more careful in their investments due to the prevailing market situation in the short term.
This article contains market analysis and price predictions. These are not guarantees. Crypto markets are volatile. Always DYOR. Not financial advice.
Also Read: SUI Price Breaks Descending Channel as Momentum Builds Toward $4.20

Be the first to comment