


Bitcoin Cash price plunged sharply this week after losing the key psychological $400 support level, raising concerns that the cryptocurrency could revisit its 2025 lows if bearish momentum continues accelerating.
Summary
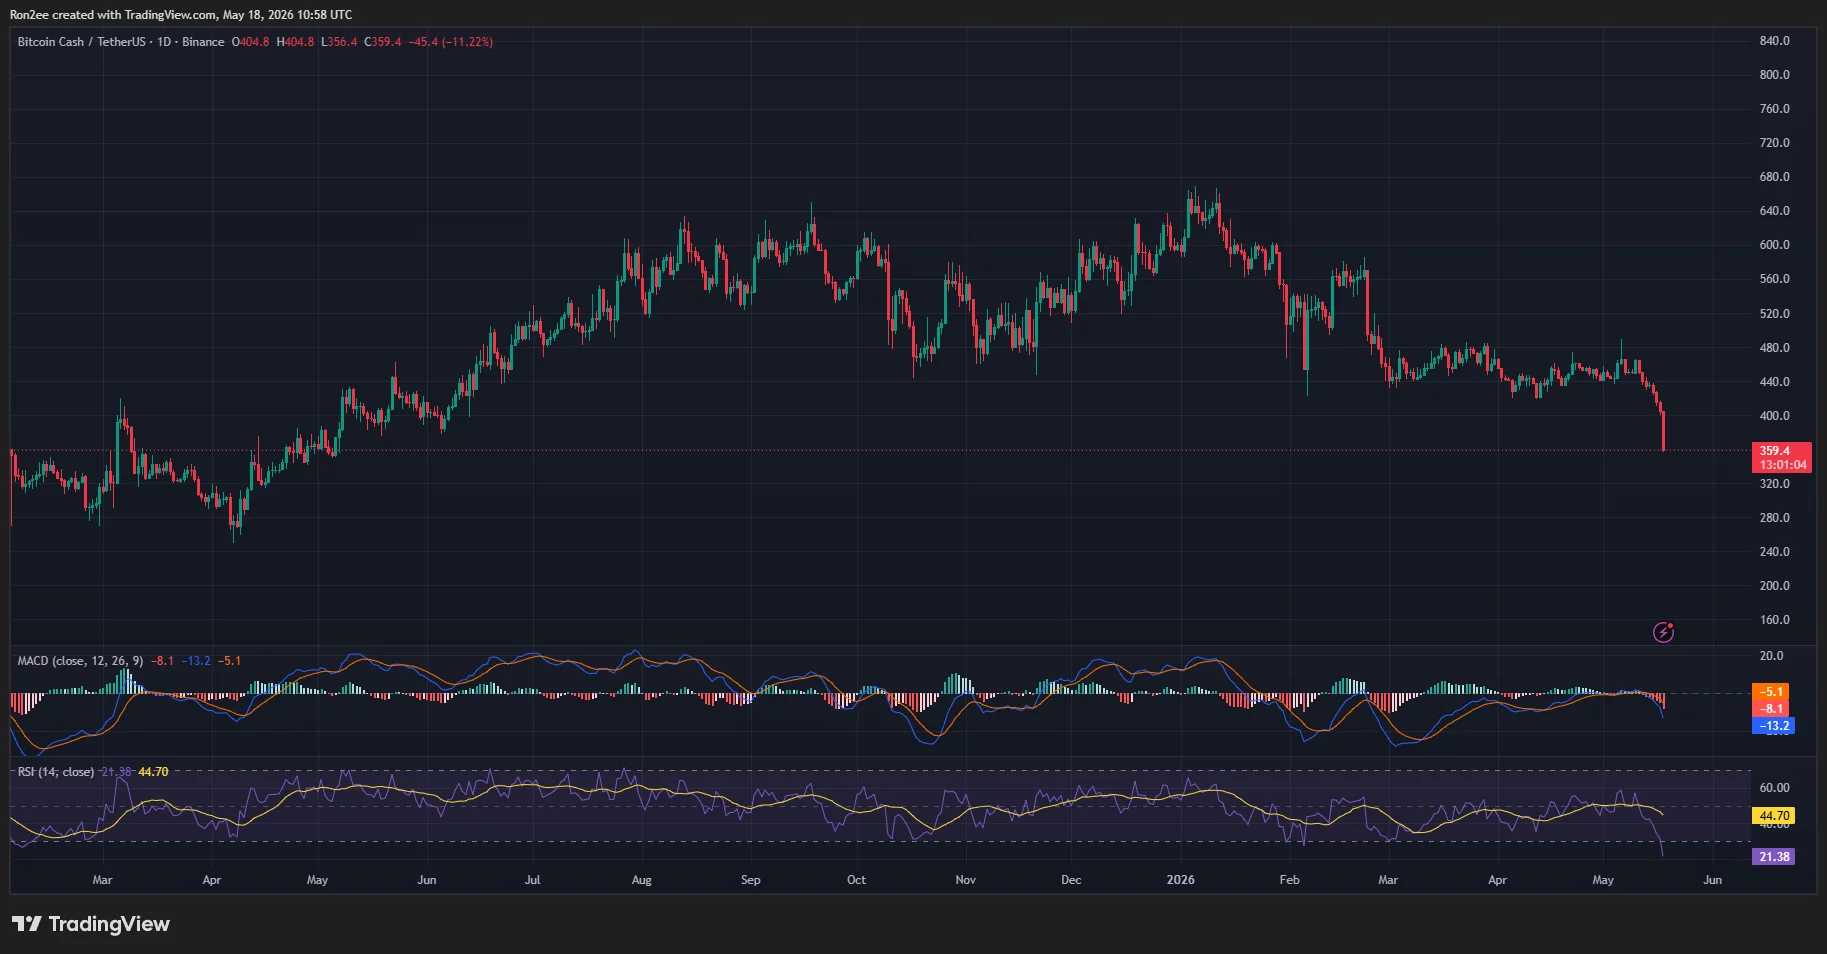
- Bitcoin Cash price plunged more than 11% below the key $400 support level, falling to its lowest point since early March.
- Bearish momentum strengthened after a MACD bearish crossover, while RSI dropped near 21, signaling deeply oversold conditions.
- Analysts now see the $320–$340 region as the next major downside target if BCH fails to reclaim the broken $400 support zone.
According to data from crypto.news, Bitcoin Cash (BCH) price dropped over 11% to trade near $359 at press time on May 18, marking one of its steepest single-day declines in recent months. The latest sell-off pushed BCH to its lowest level since early March as sellers regained full control of the broader trend.

The correction comes amid renewed weakness across the broader altcoin market as investors reduced exposure to risk assets following Bitcoin’s recent rejection near local highs.
Bitcoin Cash has also struggled to sustain bullish momentum over the past several months despite periodic rebounds tied to Bitcoin rallies and renewed speculative activity surrounding legacy proof-of-work cryptocurrencies.
While BCH is often viewed as a high-beta proxy for Bitcoin due to its shared origins and similar payment-focused narratives, the token has significantly underperformed BTC during the latest market cycle.
Market sentiment surrounding Bitcoin Cash has also weakened as trading activity and capital rotation increasingly shifted toward newer blockchain ecosystems and institutional-focused assets.
At the same time, derivatives sentiment appears to have deteriorated further as bearish positioning accelerated following the latest breakdown below support.
On the daily chart, Bitcoin Cash price has now decisively broken below the key $400 support zone that had previously acted as a major floor throughout the past several months.
The breakdown also confirms a continuation of the broader bearish trend that has remained intact since BCH failed to reclaim the $640 resistance region earlier this year.
Momentum indicators suggest sellers remain firmly in control. The MACD indicator recently confirmed another bearish crossover, while the histogram continues printing expanding negative momentum bars. This setup often signals strengthening downside pressure as bearish momentum accelerates.
Meanwhile, the RSI has dropped toward the oversold region near 21, reflecting extremely weak short-term buying strength following the latest sell-off. While oversold RSI conditions can sometimes trigger temporary relief rallies, they also highlight the intensity of the ongoing bearish trend.
The latest breakdown additionally places Bitcoin Cash at risk of revisiting its 2025 lows near the $320–$340 region if sellers continue defending the broken $400 support zone as new resistance.
A breakdown below that area could expose BCH to an even deeper correction toward the psychological $300 level.
On the upside, bulls would first need to reclaim the $400 region to stabilize short-term momentum. A successful recovery above that level could allow BCH to retest the next major resistance zone near $440, though broader momentum currently remains tilted heavily in favor of sellers.
Disclosure: This article does not represent investment advice. The content and materials featured on this page are for educational purposes only.

Be the first to comment