


What actually moved the tape
The week opened with markets pricing in a fragile ceasefire in Iran and a 10-year Treasury yield of 4.6 percent. Sentiment shifted rapidly as Donald Trump took to his social media channels to post on potential military action. Diplomatic interventions from Saudi Arabia, Qatar, and the UAE pulled the reversal back, but the risk premium remains elevated.
Brent crude traded between $110 and $112 as shipping through the Strait of Hormuz effectively halted. The US 10-year yield climbed to a 16-month high of 4.7 percent, repricing duration-sensitive assets lower.
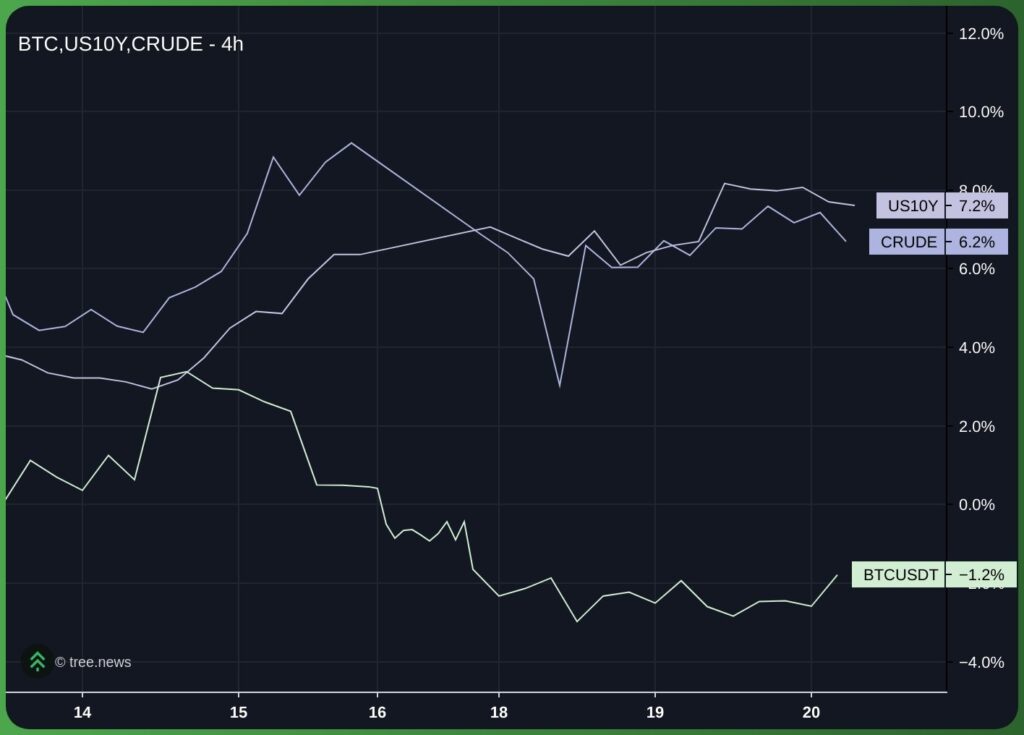
Bitcoin moved with this global trend rather than independently. Following last week’s decline, in line with waning institutional demand, bitcoin opened the week at $77,385, and slid below $77,000 on Monday and reached a session low of $76,031.
The failure to hold the $80,000 region, where multiple confluence factors lined up around on-chain cost basis metrics such as the Short-Term Holder Realised Price (STHRP) and the True Market Mean (TMM), was in line with our expectations. The open question is whether BTC can hold above the May Monthly Open of $76,318, which was held as support on the first test.

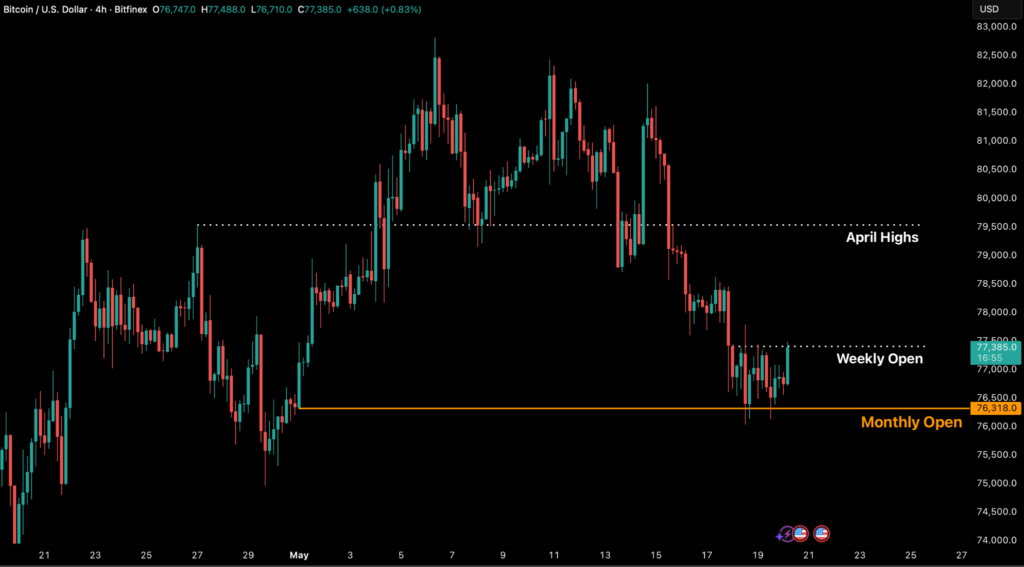
By Wednesday morning BTC had recovered slightly over $77,500, retesting the Weekly Open of $77,385. Sustained taker-side demand is required to continue the uptrend that has formed on the mid-timeframes.
The drawdown reflects global macroeconomic factors rather crypto-native issues.
Derivatives: leverage cleared, not reset
Monday’s market volatility triggered $657 million in liquidations across crypto futures. $584 million came from long positions, the largest single-session long wipe-out since early February. The deleveraging cleared out a significant portion of long positions accumulated during the early-May push toward $82,000.
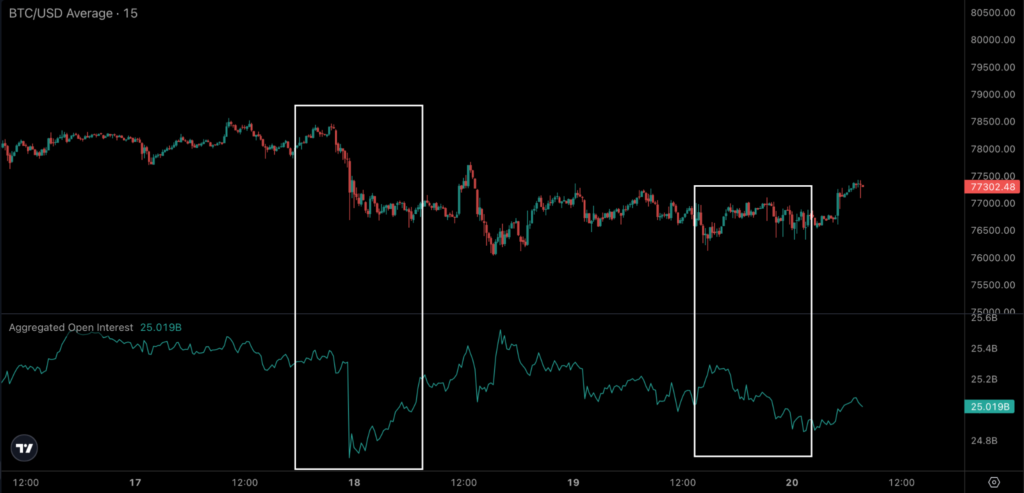
Open interest declined by roughly $1.5 billion late last week, with another drop on Monday. The fuel from previous short positions has been exhausted, and recent long buyers have been forced out.
Any directional move will likely depend on spot market activity rather than current derivatives positioning.
On-chain: the operative floor failed
Despite a 37 percent rise from the $60,000 floor we saw on 11 May, uncertainty remains a defining feature of the market. Capital inflows are relatively weak compared to the price move. To map the current structure, we use the Realised Price by Age metric to identify where different investor cohorts are likely to buy or sell based on their average acquisition costs.
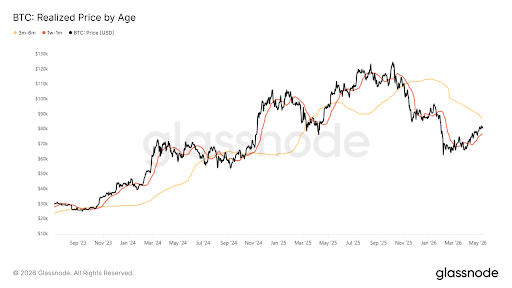
The immediate support level is anchored by the 30-day accumulator cohort, whose cost basis is near $76,500. This aligns closely with the Monthly Open and we expect it to be a strong support zone in the short term.
A sustained break below would signal a drop in short-term investor conviction. Higher up, the $85,900 level represents a major resistance zone, as investors who bought during the November to February period reach breakeven and may look to distribute their holdings.
With BTC trading below the short-term holder’s realised price of roughly $79,000 for several sessions, this group now represents potential overhead supply that could limit price gains during a recovery, as short-term profit-taking continues, albeit at a slower pace than before.
The lack of trading volume between $72,000 and $82,000 creates a structural challenge, as there are few dense reclaim bands to support the price. Without organic on-chain demand, a recovery would likely require either significant treasury or Exchange Traded Funds (ETF) buying, or a derivatives-driven short squeeze above $80,000.
On the positive side, exchange reserves remain at a seven-year low of 2.21 million BTC, and long-term holder supply is steady at 14.43 million BTC.
The current price decline isn’t being driven by an increase in supply but by a relatively weakened demand funnel.
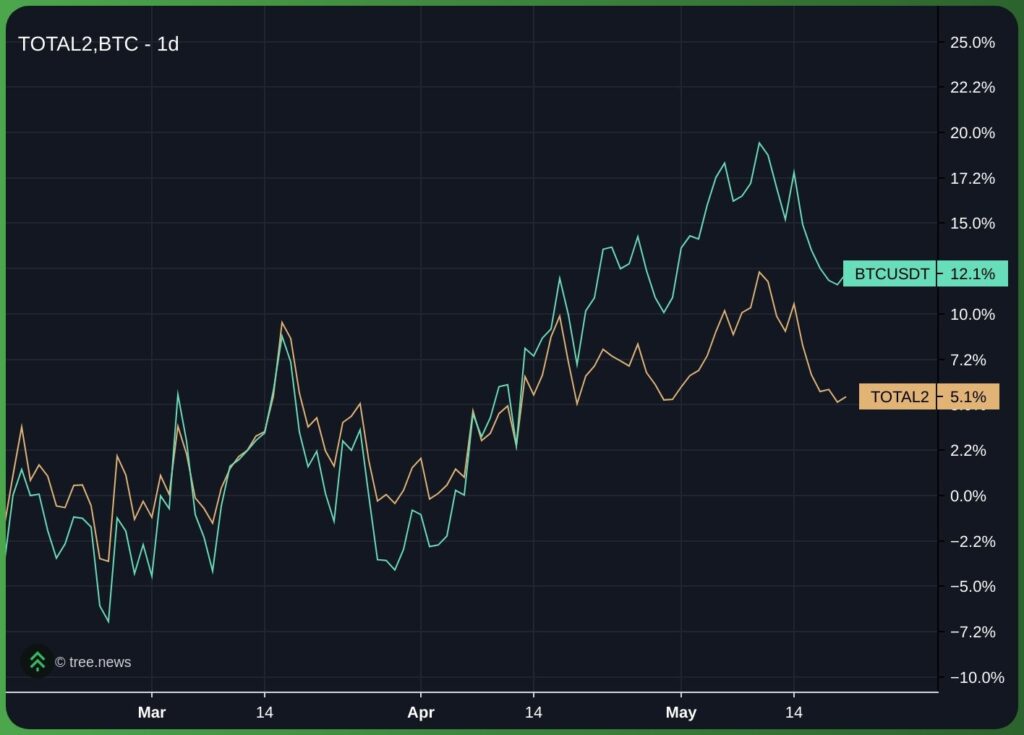
Altcoin breadth: dispersion, not rotation
Altcoins aren’t attracting independent capital, they’re moving in lockstep with bitcoin. Bitcoin dominance remains near 60 percent, and the Altcoin Season Index stays well below the threshold for a market rotation. Most large-cap altcoins have underperformed bitcoin over the last 90 days.
Performance within the altcoin market is varied. Assets with active ETF cycles, like XRP and SOL, saw some inflows, while others posted weekly declines. HYPE, with strong positive catalysts, outperformed other large caps.
Structurally, altcoins require a stable or trending bitcoin market to perform well. With BTC stuck in a volatile range, altcoin participation has naturally compressed.
Stablecoin plumbing: the only channel still net positive
Stablecoin market capitalisation rose to $322 billion, adding $2 billion in a week. USDt and USDC both saw significant minting. This serves as a contrarian signal: while ETF and corporate channels slowed, dollar-pegged liquidity on exchanges expanded.
The fuel for a potential move back above $80,000 is available but not yet deployed.
Cross-asset: gold, silver, equities
In the current geopolitical context, the US dollar has emerged as the primary safe haven, absorbing demand that might otherwise go to precious metals.
Gold prices stayed below $4,550 despite high yields and geopolitical conflict, failing to capture the expected safe-haven bid. Silver traded more like an industrial asset on the back of trade developments between the US and China.
Equity volatility picked up as the Nasdaq’s six-week rally cooled. Rising rates and a strong dollar are the primary drivers across the broader market. Bitcoin continues to correlate closely with long-duration tech assets, absorbing losses alongside other risk-sensitive markets.


Be the first to comment