


Algorand price has started regaining momentum this month as traders rotate back into select layer-1 tokens supported by improving technical structures, rising on-chain activity, and fresh exchange accessibility catalysts.
Summary
- Algorand price approached a potential golden cross as the 50-day SMA moved closer to crossing above the 200-day SMA near the $0.116 resistance zone.
- Robinhood expanded Algorand trading access to U.S. users, adding millions of potential retail investors after its earlier European rollout.
- Rising on-chain activity, growing RWA tokenization narratives, and stable tokenomics strengthened bullish expectations for a possible recovery toward $0.20.
According to data from crypto.news, Algorand (ALGO) price traded around $0.114 at press time on May 20 after climbing more than 39% from its March lows near $0.082. The token has also stabilized above the key psychological $0.10 zone for several consecutive weeks, suggesting buyers are beginning to defend higher support levels after months of sustained downside pressure.

One of the biggest catalysts supporting Algorand’s recent recovery is its official launch on Robinhood Crypto for users across the United States. The rollout significantly expands retail access to ALGO and potentially introduces a fresh source of liquidity from millions of American users who can now directly trade the token through one of the most widely used brokerage applications in the country.
The listing also follows Robinhood Europe’s earlier support for Algorand, meaning the token is now available to both U.S. and European users through the platform. Historically, major exchange accessibility expansions have often improved visibility and trading activity for mid-cap crypto assets seeking to recover from prolonged bearish cycles.
At the same time, Algorand has continued benefiting from improving regulatory sentiment in Asia. Earlier this year, the token was officially green-listed by Japan’s Virtual and Crypto Assets Exchange Association, or JVCEA, allowing licensed exchanges in the country to offer the asset more freely to local investors. The development triggered a strong rally at the time and helped reinforce investor confidence surrounding the project’s long-term regulatory positioning.
Additional support has also emerged from growing optimism surrounding the Real-World Asset tokenization sector. Algorand has increasingly positioned itself as an institutional-grade blockchain due to its sub-penny transaction costs, instant finality, and long track record of network uptime.
The network has recently seen notable increases in transaction activity, developer engagement, and wallet participation despite ALGO still trading far below its historical highs. Such divergence between network fundamentals and token price often attracts speculative buyers looking for undervalued ecosystems with improving utility metrics.
Staci Warden, CEO of the Algorand Foundation, previously emphasized the network’s focus on institutional-scale infrastructure and tokenization use cases.
“The future of finance will be built on blockchain infrastructure that institutions can actually trust and scale,” Warden said during a recent industry panel discussing tokenized assets and blockchain adoption.
That institutional narrative has become increasingly important as capital continues rotating toward blockchain networks viewed as suitable for tokenized treasuries, payment infrastructure, and enterprise settlement systems.
Can Algorand’s golden cross trigger a long-term reversal?
On the daily chart, Algorand price is now approaching one of its most important technical milestones in months: a potential golden cross formation between the 50-day and 200-day simple moving averages.
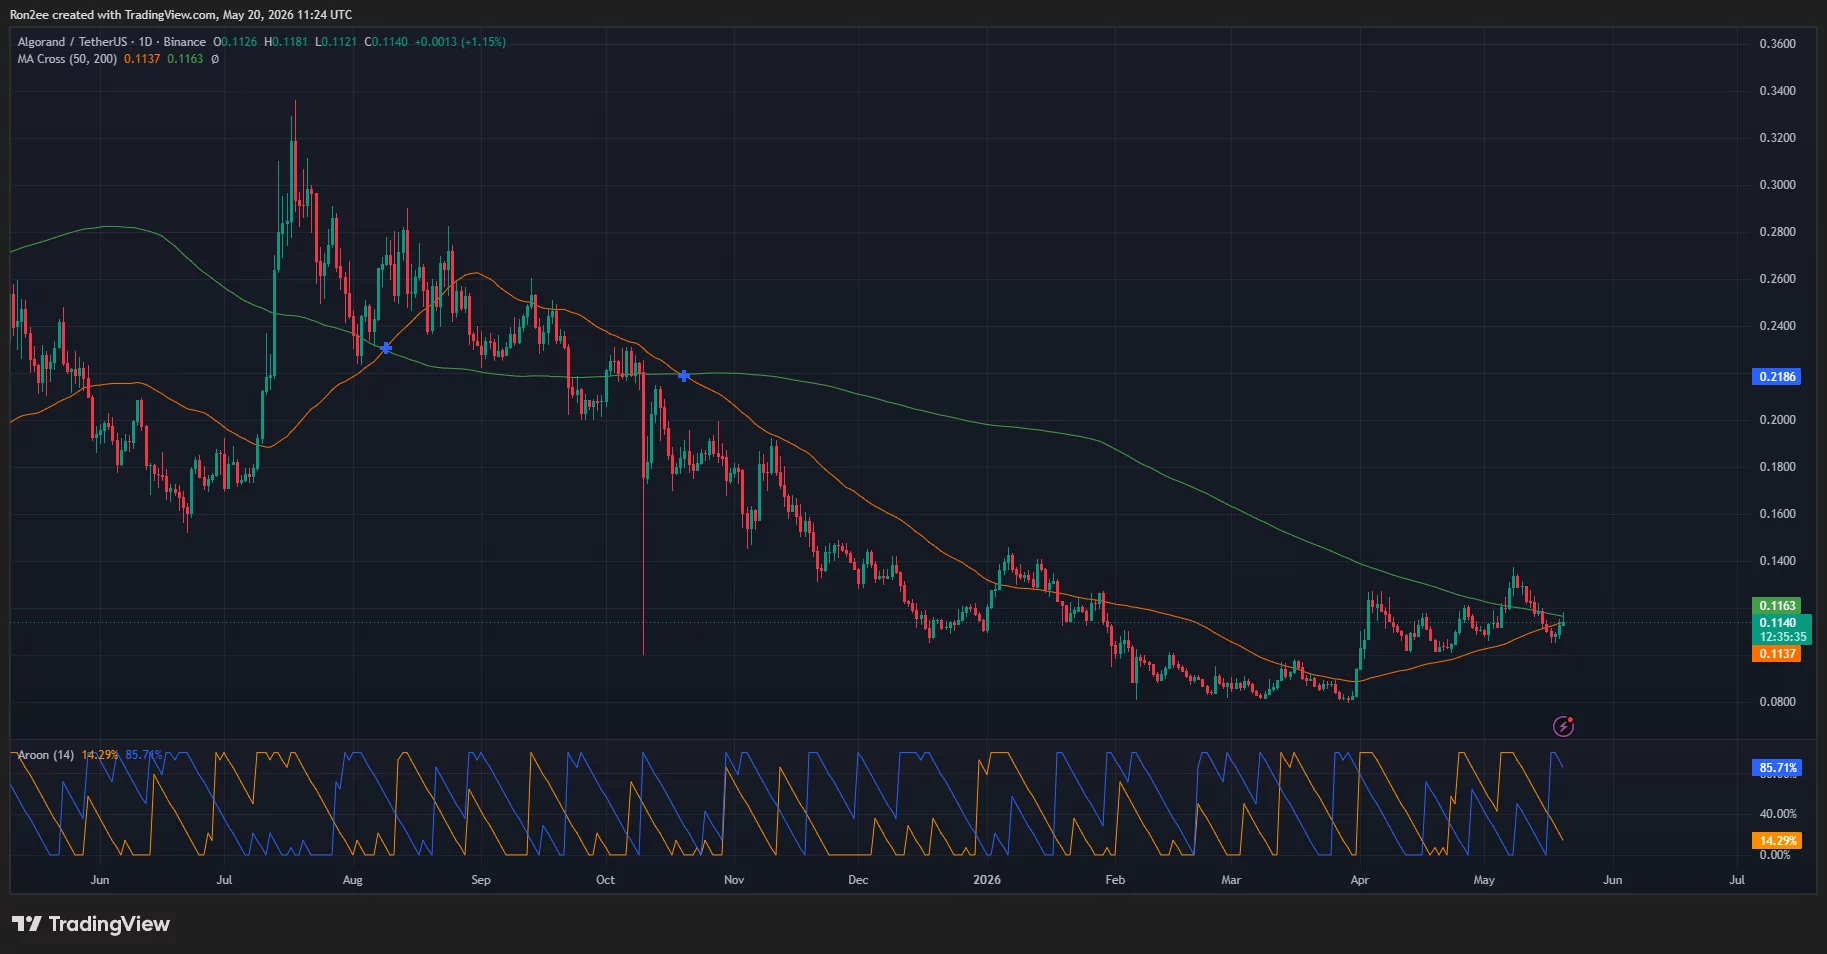
Currently, the 50-day SMA sits near $0.1137 while the 200-day SMA is positioned around $0.1163. The gap between both indicators has narrowed substantially over the past several weeks as ALGO maintained a sequence of higher lows following its March bottom near $0.08.
A golden cross occurs when the shorter-term moving average crosses above the longer-term average, signaling that medium-term momentum is beginning to overpower the broader bearish trend. Traders often interpret such crossovers as the early stages of a larger macro trend reversal.
The current structure also appears constructive because Algorand has already reclaimed its 50-day SMA and continues consolidating directly beneath the 200-day SMA resistance zone. This suggests buyers are attempting to build enough momentum for a decisive breakout rather than immediately rejecting from overhead resistance.
Meanwhile, the Aroon indicator is flashing increasingly bullish signals. Aroon Up currently sits around 85.7, while Aroon Down has dropped close to 14.2, indicating that bullish momentum is dominating recent price action and that recent highs are occurring more frequently than recent lows.
The broader chart structure also suggests Algorand may have already formed a major macro bottom between the $0.08 and $0.09 range after spending months in a prolonged accumulation phase.
Technical analysts are closely watching whether ALGO can successfully reclaim the 200-week SMA positioned near the $0.19 to $0.20 region. Historically, reclaiming the 200-week moving average has often marked the beginning of stronger recovery phases across major crypto assets emerging from deep bear markets.
If the current golden cross confirms alongside a broader altcoin market recovery, that confluence could significantly strengthen bullish momentum toward the $0.20 resistance threshold.
What could prevent ALGO from reclaiming $0.20?
Despite the improving setup, Algorand still faces several major hurdles before confirming a full long-term trend reversal.
First, the $0.12 to $0.14 region remains a heavy supply zone where sellers repeatedly rejected previous recovery attempts earlier this year. A decisive breakout above this range would likely be required before traders seriously begin targeting the $0.20 psychological level.
In addition, Algorand continues trading substantially below its major 2024 highs, meaning many long-term holders may still look to exit positions during relief rallies after enduring prolonged drawdowns throughout the broader market downturn.
Macro conditions also remain an important risk factor. Crypto markets continue reacting sharply to U.S. monetary policy expectations, Treasury yield volatility, and broader risk appetite conditions. If Bitcoin loses momentum or macroeconomic uncertainty intensifies again, altcoins like Algorand could struggle to sustain recovery rallies regardless of improving fundamentals.
Still, one factor working in Algorand’s favor is its relatively stable tokenomics structure compared to many competing layer-1 networks. Approximately 89% of ALGO’s 10 billion maximum supply is already circulating in the market, meaning the ecosystem faces far less structural dilution pressure from future token unlocks.
That matters because many altcoins experiencing strong rallies often face immediate sell pressure from large insider or treasury unlock schedules. Algorand’s comparatively mature circulating supply profile reduces that risk and allows spot demand to have a more direct impact on price action.
The improving technical structure, Robinhood expansion, institutional tokenization narrative, and strengthening on-chain activity together suggest Algorand may finally be entering the early stages of a broader recovery cycle after spending years under sustained bearish pressure.
For now, the most important level to watch remains the 200-day SMA near $0.116. A clean breakout above that resistance, followed by confirmation of the golden cross, could significantly improve the probability of a move toward the long-term $0.20 target over the coming months.
However, failure to hold above the 50-day SMA near $0.113 would weaken the current bullish setup and potentially expose the token to another retest of lower support zones near $0.10 and $0.08.
Disclosure: This article does not represent investment advice. The content and materials featured on this page are for educational purposes only.

Be the first to comment