


What to know:
- Litecoin (LTC) is consolidating near key support after a sharp decline, with low volatility signaling a potential breakout.
- LTC trades around $54 as traders watch if the price holds support or rallies toward the $64 resistance zone.
- The Litecoin Foundation’s new MWEB dashboard improves transparency into privacy transactions and network activity.

Litecoin (LTC) is compressing near key support after a sharp decline, with low volatility suggesting an imminent breakout or breakdown for the Litecoin price. Indicators show weakening bearish momentum and consolidation. Meanwhile, a new MWEB dashboard improves visibility into privacy transactions and strengthens network transparency.
At the time of writing, LTC is trading at $54.04 with a 24-hour trading volume of $267.79 million and a market capitalization of $4.17 billion. Following the 1.28% gain over the last 24 hours, the question is whether the LTC could maintain its support or lead to deeper retracements.
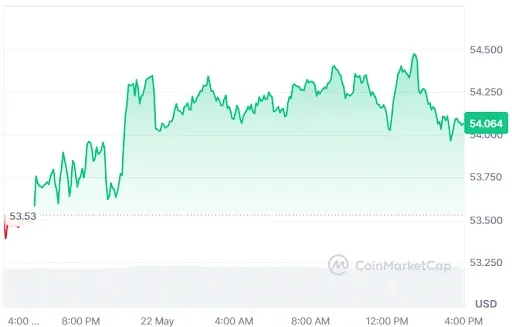

Source: CoinMarketCap

Litecoin Price Targets $64 After Testing Support
According to the crypto analyst Matthew Dixon, the Litecoin price is approaching a critical technical inflection point after dropping to the lower boundary of its established trading channel, a level widely anticipated by traders.
Market structure now suggests increasing pressure as price compresses near support. This zone is acting as a key decision area where momentum could soon shift sharply in either direction.


Source: Mattheon Dixon’s X Post
From here, LTC faces two potential outcomes: a breakdown below support that could extend bearish momentum or a final relief rally toward the upper channel boundary near $64.
Traders are watching for confirmation before committing, as volatility is expected to expand once the Litecoin price decisively breaks out of the current consolidation structure.
Also Read: Litecoin Price Prediction: Can LTC Surge 543% After Recent Pullback?
Technical Indicators Point to Consolidation Phase
According to TradingView, the Litecoin price is in a long downtrend trend that has now settled to a narrow consolidation.
Having fallen from $130.00 to the bottom of $44.00, the Litecoin price action became stagnant, as seen through Bollinger Bands. This token is trading near $54.07, trapped in between the 20-period MA and the lower Bollinger Band.


Source: TradingView
The MACD suggests a gradual decrease in the bearish pressure. Both lines in the indicator slowly move up from strongly negative values but remain below the zero level. The flat histogram also reflects such dynamics.
It demonstrates that the Litecoin price is at a state of structural equilibrium, which often precedes sharp and turbulent breakout action.
Litecoin Explorer Adds MWEB Dashboard Update
The data from the Litecoin Foundation further highlighted that the Litecoin Explorer has undergone an important update with the creation of an MWEB dashboard, which increases transparency in the private blockchain system.
This allows people to track the dynamics of supply and transactions and other operations that take place at the block level on the MWEB blockchain.

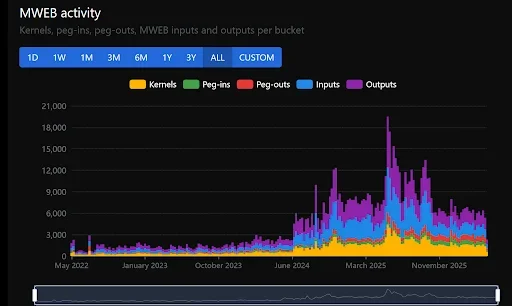
Source: Litecoin Foundation’s X Post
The inclusion of an MWEB dashboard on Litecoin will help improve transparency without sacrificing privacy of choice, making it easier to monitor adoption and network performance.
The result is a more powerful Litecoin Explorer that can be useful for those interested in monitoring private transactions and usage trends within the entire ecosystem.
This article contains market analysis and price predictions. These are not guarantees. Crypto markets are volatile. Always DYOR. Not financial advice.
Also Read: Litecoin Price Forms Rounding Top: Will $56.25 Support Hold?

Be the first to comment