


Despite the recent stabilization around the mid-$70,000 region, Bitcoin remains trapped in a transitional structure that still leans bearish on the higher timeframe. The chart displays a decline that began in the vicinity of $125,000 following the rejection.
More important than the current short-term bounce is the fact that Bitcoin has continuously traded below the major moving averages since then.
The main obstacle is still the 200-day moving average, which is currently in the low $80,000s. Every significant rally since the breakdown has failed before regaining that level. The price is currently trying to compress between the 50-day and 100-day averages around $76,000 and $78,000, but there isn’t much momentum.

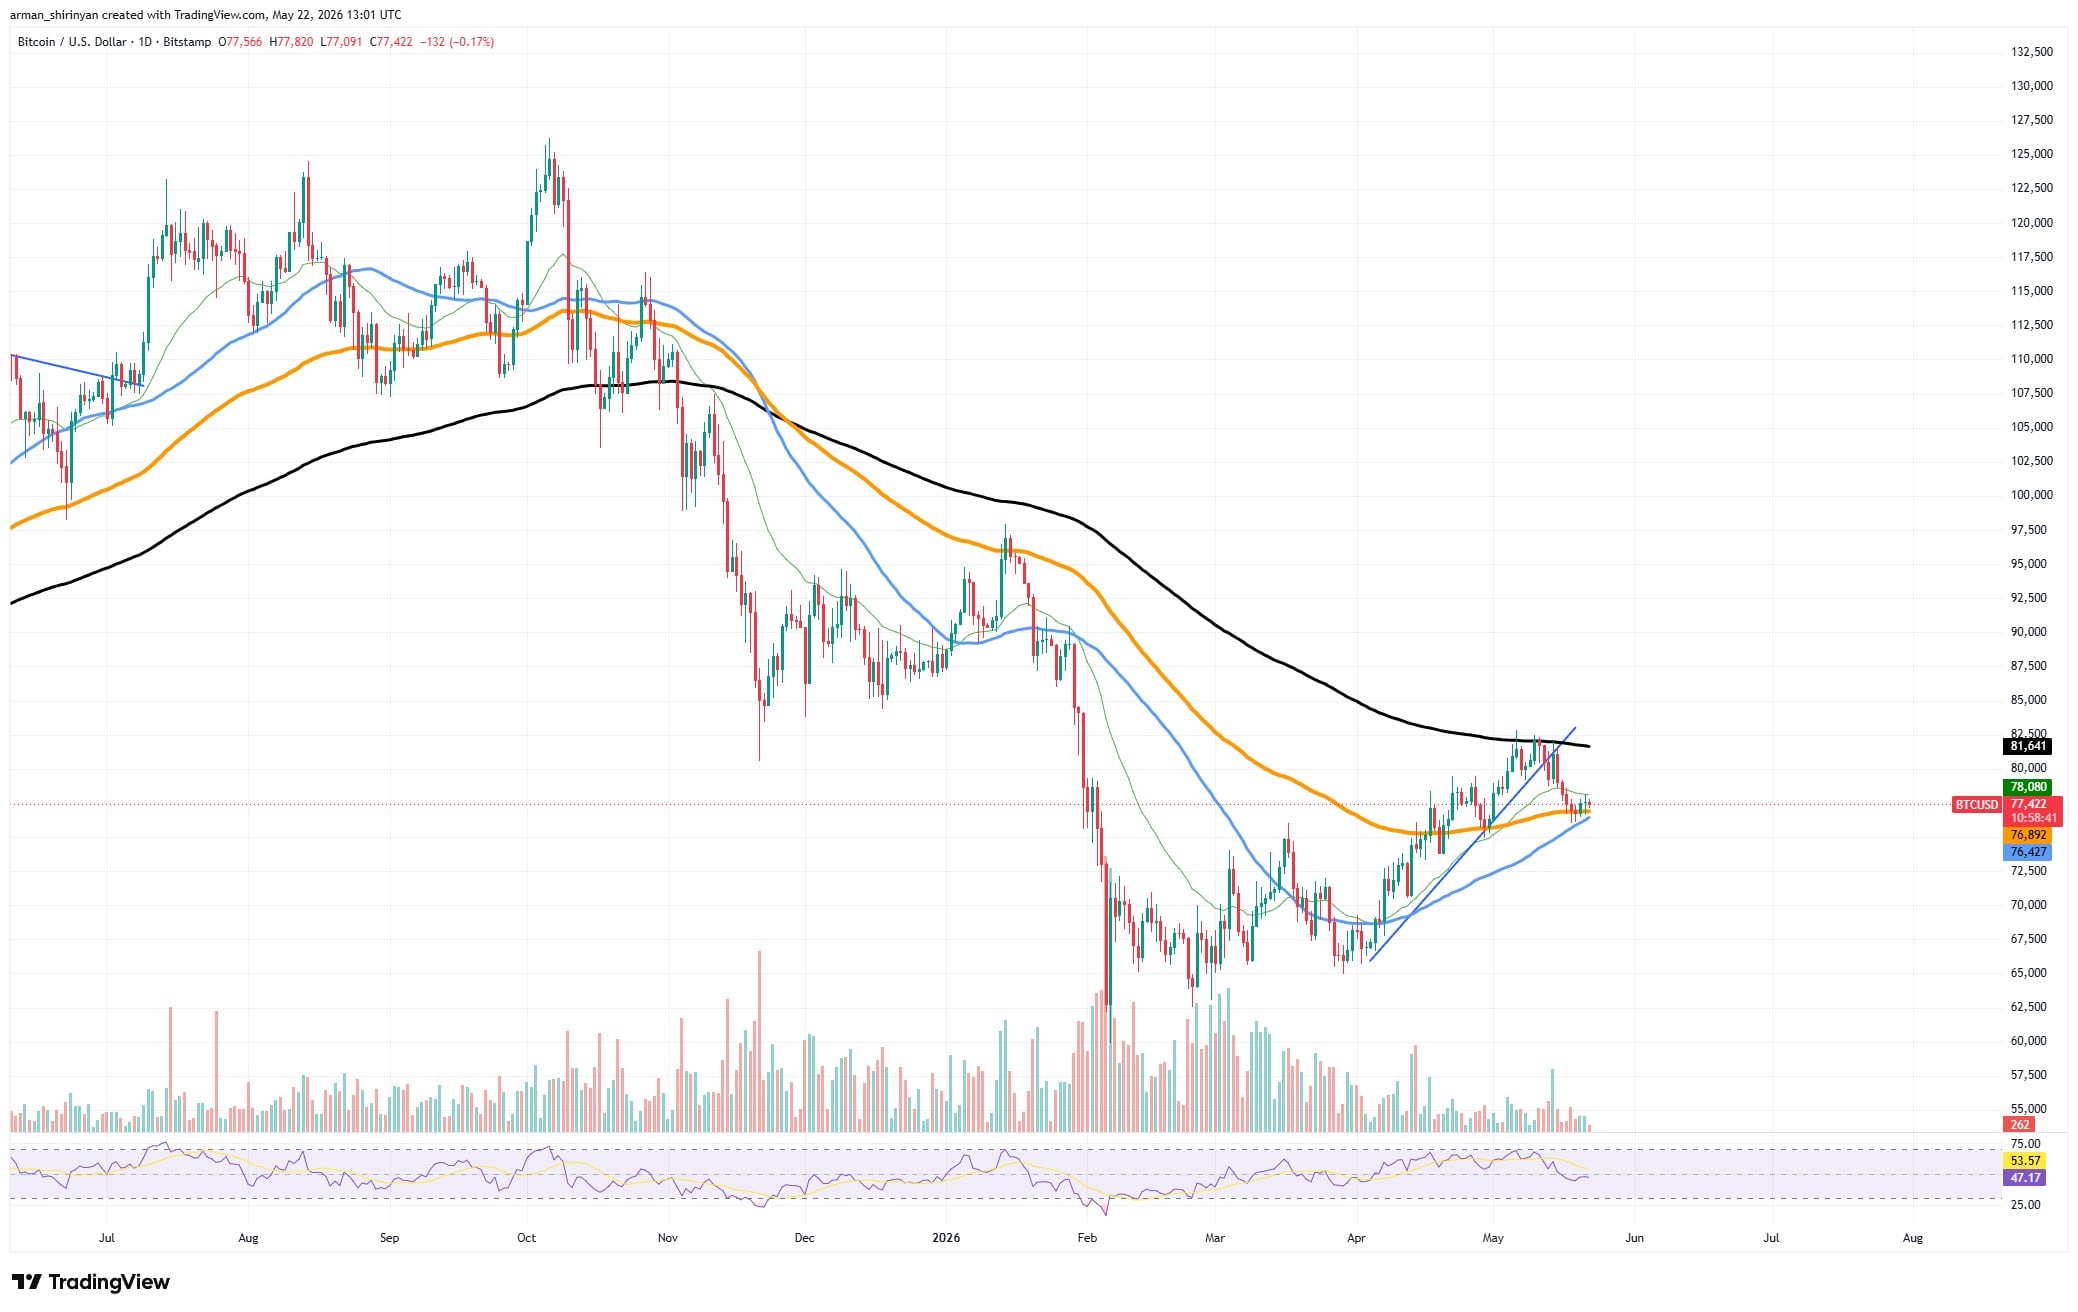
Additionally, compared to the selloff phase earlier in the trend, volume has drastically decreased, indicating that buyers are not yet actively intervening. The structure is more akin to a relief consolidation rather than a confirmed reversal.
Although the market still lacks a clear breakout candle with substantial volume confirmation, Bitcoin did manage to create a higher low following the decline toward the $65,000 area, which is encouraging. That indecision is reflected in the RSI hovering around the neutral 50 zone. Momentum is no longer under the control of bulls, but bears are also not entirely dominant.
The black 200-day average overhead is the most significant level on the graph. The larger trend is still susceptible to another rejection until BTC closes above that area and holds it. It becomes feasible for the price to return to the low $70,000s or even the upper $60,000s if the cluster around the blue and orange moving averages is lost.
On the optimistic side, persistent closes above $78,000–$80,000 would significantly alter the structure of the market and raise the prospect of a longer recovery leg. However, based only on this chart, Bitcoin still appears to be an asset that is attempting to bottom out following a significant correction rather than one that is about to enter a clear expansion phase.
Hyperliquid Already Transitioning Into Growth
Currently, one of the strongest charts available is Hyperliquid. In contrast to Bitcoin, HYPE has already made the shift from recovery to outright growth.
The most recent breakout candle is strong, almost vertical, and supported by a noticeable acceleration of momentum. The price immediately pushed into price discovery around the low $60 range after blowing through earlier resistance near the high $40s.
The alignment of the moving averages is highly optimistic. While the 200-day average is still rising below price, the short-term average is located significantly above the medium-term averages. When combined with rising volume and strong candle bodies, a full bullish stack typically indicates trend continuation rather than exhaustion.
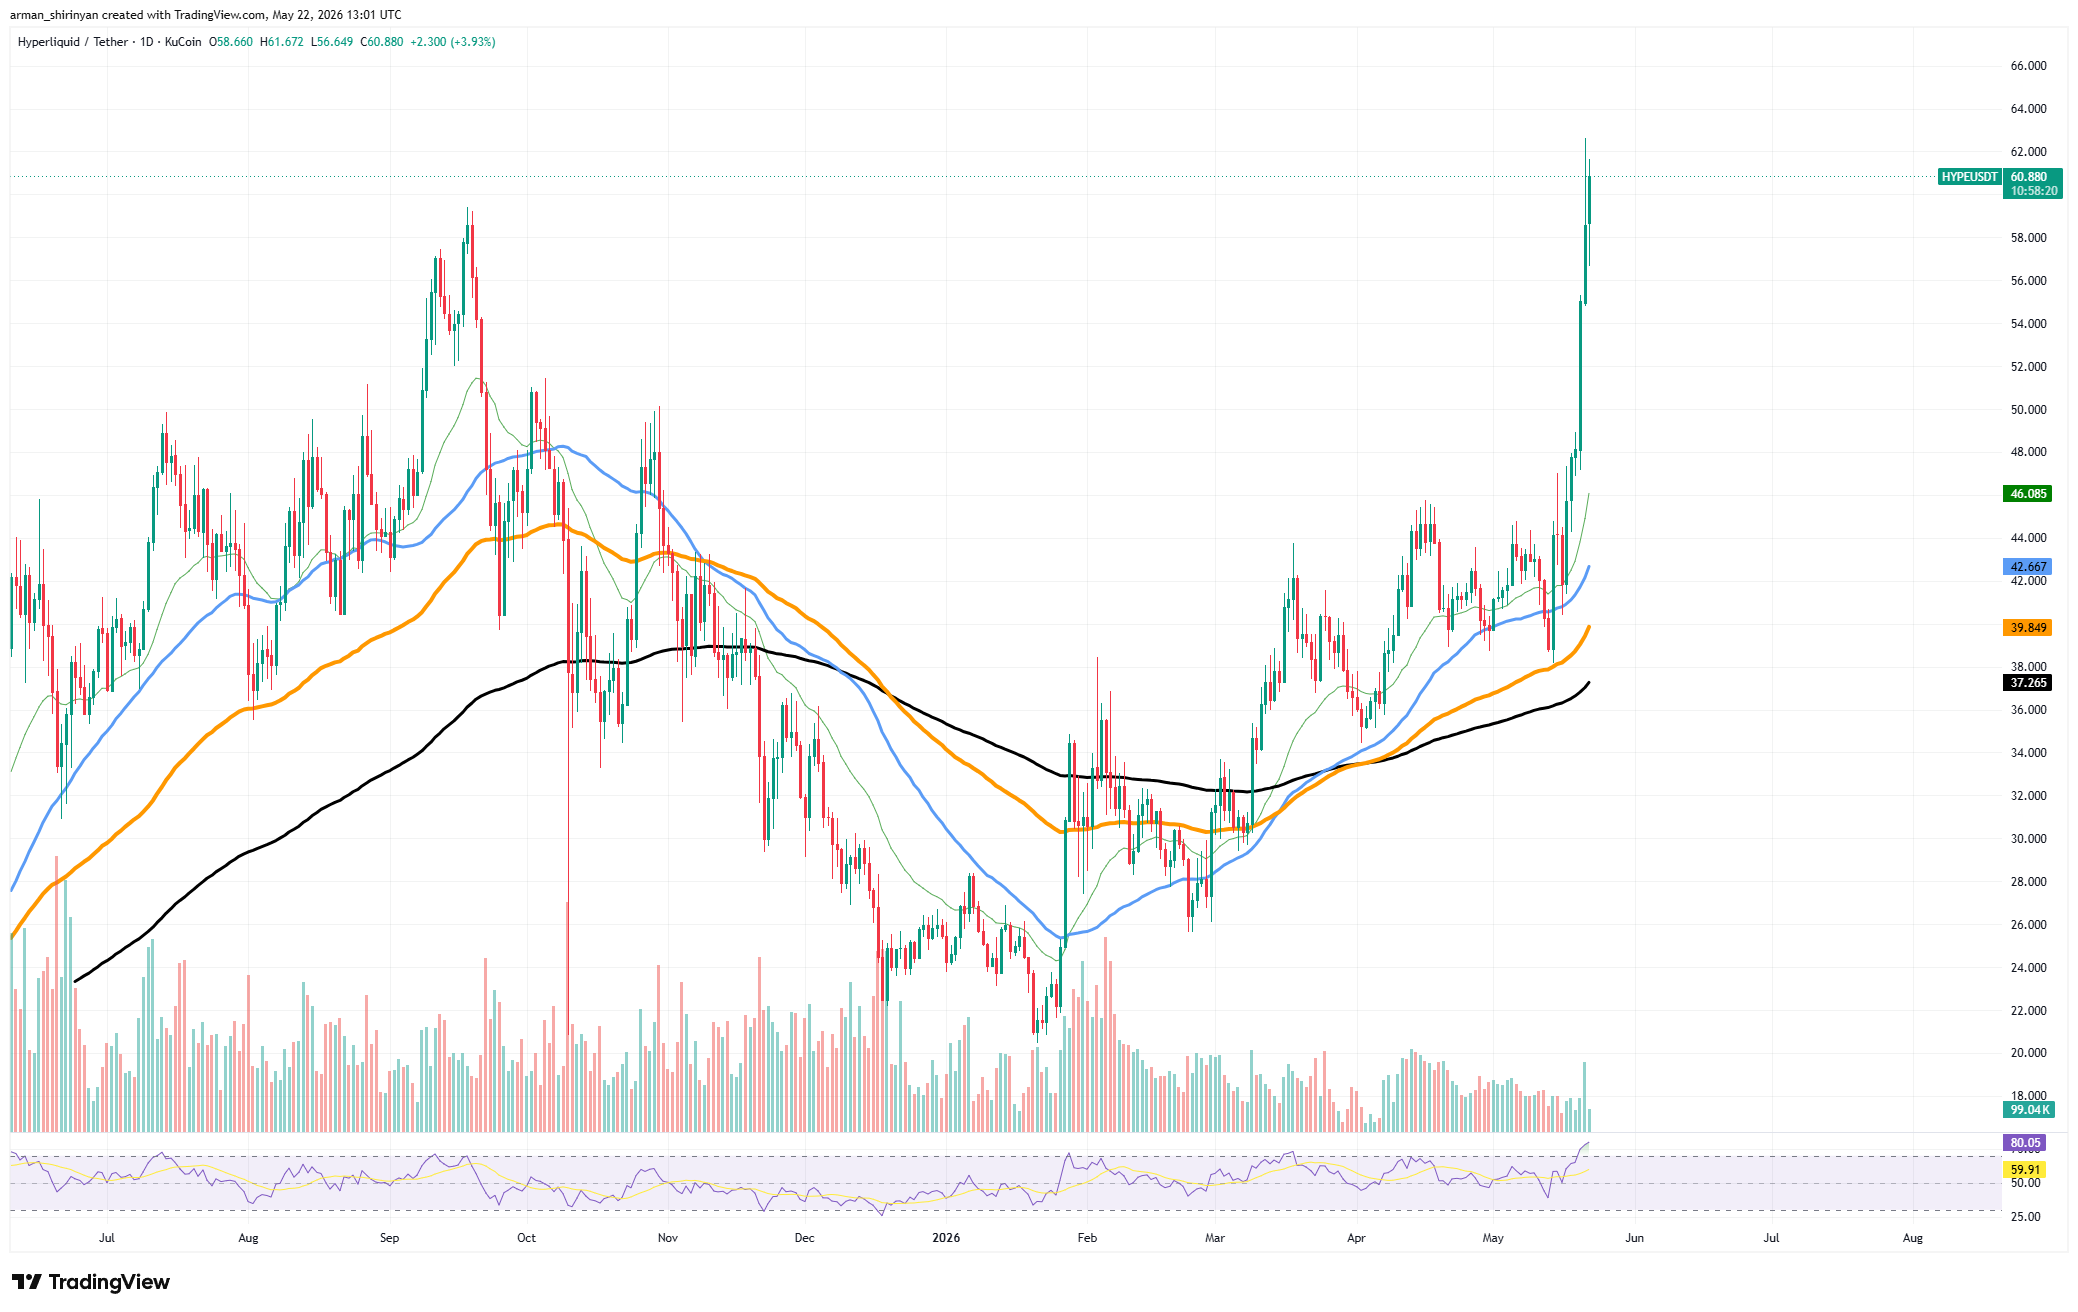
Additionally, the rising trendline derived from the March lows is still in place. Strong dip-buying behavior is confirmed by the fact that every pullback during the climb found support above the prior swing low. Another indication of aggressive accumulation is that HYPE never went into a deep corrective phase during this advance.
Nevertheless, the chart now appears to be overheated in the near future. The likelihood of local cooling has historically increased as the RSI moves toward overbought territory around 80. The most recent candle extension above the fast moving averages is enormous, and such parabolic moves seldom last without at least brief consolidation.
Whether HYPE violently mean reverts or forms continuation above the breakout zone is the crucial question. The trend will probably continue higher if bulls defend the $55-$58 range on any pullback. Because vertical moves frequently result in weak support underneath, losing that zone quickly could cause a sharp flush.
Nevertheless, this is one of the clearest bullish charts displayed here in terms of structure. The market has already broken resistance with momentum, established higher highs and higher lows, and recovered all significant moving averages. HYPE is currently acting more like an asset in a strong markup phase than a speculative bounce inside a larger downtrend, unless this breakout completely fails within the next few sessions.
Zcash Showing Explosive Momentum, but With Instability
Zcash appears to be more volatile and unstable than HYPE despite its explosive appearance. Instead of a slow institutional accumulation structure, the chart depicts a massive expansion phase that resembles momentum-driven speculation.
The price experienced a near-vertical rally toward $700 after a protracted compression around the $200-$300 range. The trend is very bullish technically. The price is well above all of the major moving averages, which are all oriented upward. While the 100-day and 200-day averages are still significantly below the current price, the 50-day average in the low $500s is serving as dynamic support.
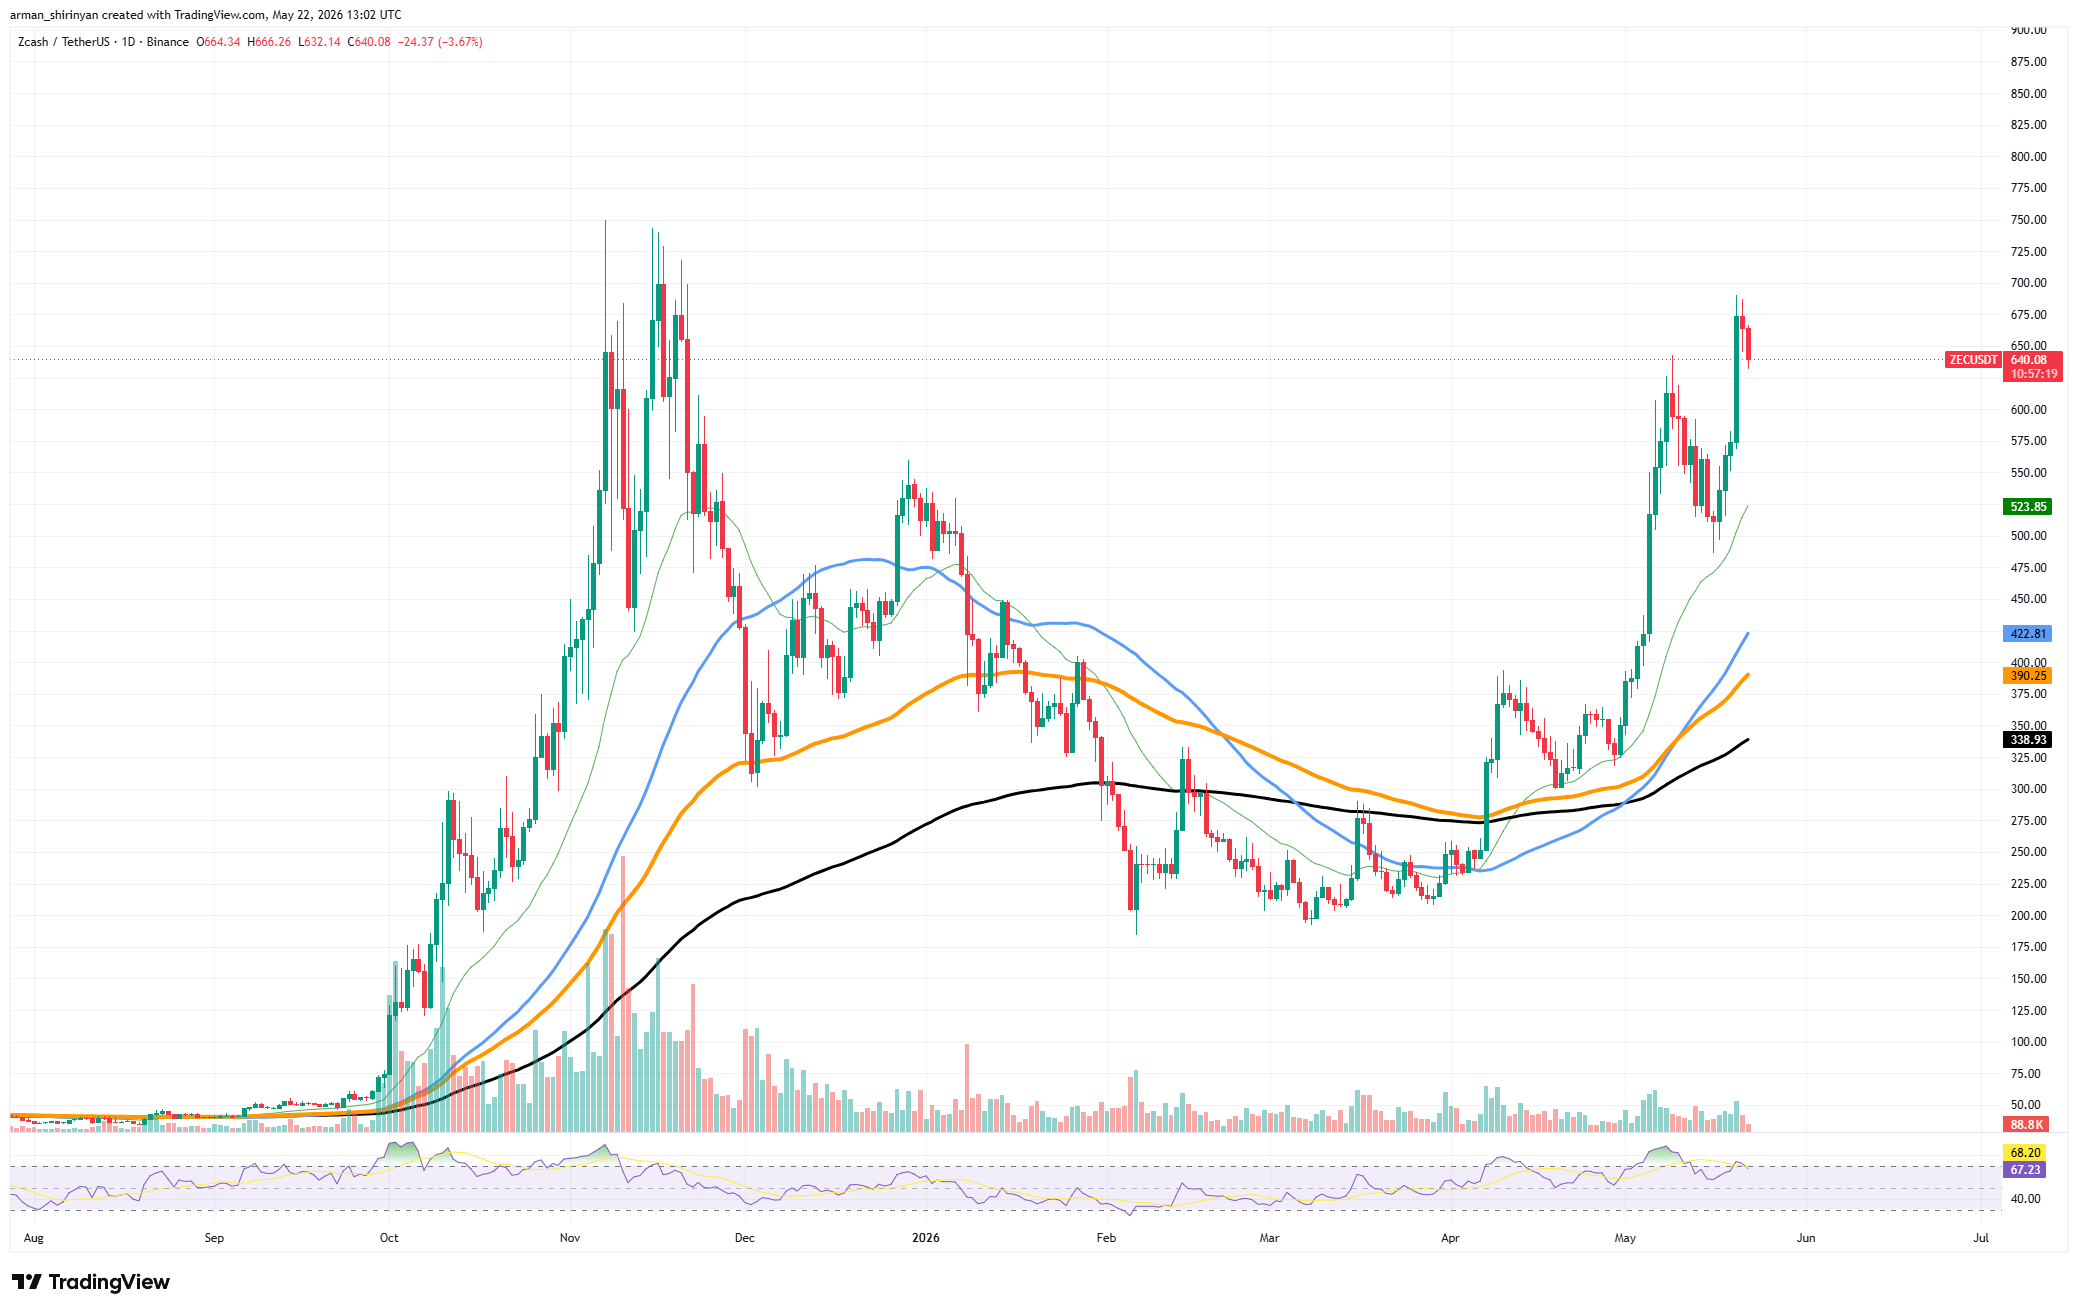
The candle structure, however, shows instability. Rapid reversals close to the highs and large upper wicks indicate traders are aggressively taking profits into strength. ZEC moves in violent bursts as opposed to HYPE’s smoother staircase structure. When momentum cools, that frequently results in corrections that are just as violent.
Volume indicates a high level of speculative involvement. A significant increase in trading activity was sparked by the breakout above the prior April highs, which contributed to the current range surge. Although it is not as high as it was at the previous peak in November, RSI is still high in overbought territory.
Sustainability is bulls’ biggest problem. Although parabolic rallies can last longer than anticipated, they typically need consolidation periods to stay healthy. Since ZEC is currently far above the medium-term averages, even a typical correction could result in a 15-25% decline without undermining the larger uptrend.
The current area of support is between $550 and $575, with more robust structural support near the fast moving average in the low $500s. Bulls may continue toward the previous cycle highs if they hold those zones. However, since the majority of the recent move occurred in a condensed timeframe, the chart may unwind quickly if momentum breaks sharply.
Based solely on the chart, ZEC is still bullish overall, but out of the three assets displayed, it has the highest likelihood of experiencing violent volatility.
Dogecoin Still Trapped Inside a Larger Bearish Structure
Despite the recent attempt to recover from the February-April base, Dogecoin continues to trade within a more general bearish market structure. Following the rejection from the $0.30 region, the chart displays a downtrend. Since then, DOGE has been unable to regain any significant higher timeframe resistance.
The compression between the moving averages on the chart is its most significant feature. Recently, DOGE was able to rise above the short-term averages and momentarily break through the 100-day moving average near $0.11, but the move quickly stalled. The price is currently caught between the heavier resistance overhead around $0.11-$0.12 and the short-term support cluster near $0.10.
You Might Also Like
Bulls have a structural case for continuation because the blue ascending trendline from the April lows is still technically intact. The issue is that momentum is still insufficient. Volume expansion during the rally was insufficient to indicate aggressive accumulation, and RSI cooled back toward neutral after momentarily approaching overbought conditions earlier in May.
Additionally, DOGE is still well below the 200-day moving average in the vicinity of mid-$0.12. For months, that black moving average has served as resistance to the macrotrend. The overall trend cannot be deemed bullish until the price firmly reclaims it.
Beneath the surface, some constructive behavior is emerging. Following the significant February decline, the price stopped printing lower lows and instead formed a rounded base through March and April. The first significant improvement in trend structure in months was the rebound above the 50-day and 100-day averages.
However, bulls may still not be strong enough to force a breakout based on the recent rejection near resistance. The chart opens space toward the 200-day average and possibly the $0.13 area if DOGE can maintain the $0.10 region and push back above $0.11 with increasing volume.
Instead, the market would be vulnerable to another move toward the April lows if the ascending support line were lost, which would likely resume the larger downtrend.
Ethereum Structurally Weaker Than Bitcoin
In terms of structure, Ethereum’s chart currently appears to be weaker than Bitcoin’s. ETH is still trapped below all significant higher timeframe resistance levels, and the most recent attempt at a rally already seems to be waning.
The asset has been trading below the 200-day moving average for months. This indicates that the macro trend still favors sellers. The 200-day moving average is still sloping downward around the mid-$2,500 range.
The descending wedge, or falling resistance structure, that forms throughout April and May is the chart’s most significant pattern. ETH failed to make a clear breakout despite repeatedly testing the upper boundary between $2,350 and $2,400. Rather, the price reversed course once more and fell below the short-term moving averages.
Another issue with the moving average alignment is still present. Both the 50-day average and the 100-day average stay below the 200-day threshold. Usually, this bearish stacking indicates pressure to continue rather than a sound recovery cycle.
You Might Also Like

Buyers were unable to create enough momentum to completely reverse the structure even when ETH recovered from the February decline and moved toward $2,000. Additionally, during the consolidation phase, volume has decreased. Participation was much higher during the earlier selloff than it was during the rebound.
Instead of starting a new bull leg, that imbalance typically indicates that the market is correcting within a longer downtrend. Weakening momentum is confirmed by the RSI drifting toward the low 40s.
At $2,100-$2,150, ETH is currently close to a crucial support area. The chart will probably revisit the psychological $2,000 level and possibly lower support areas created following the February capitulation if that area breaks.
Reclaiming the declining resistance trendline and pushing back above the moving average cluster around $2,300-$2,400 are clear prerequisites for bulls.

Be the first to comment