


What to know:
- FET shows recovery signs as bullish momentum builds, with traders targeting a breakout toward the $0.55 zone.
- Rising volume and 21.6% open interest surge signal stronger market participation and speculative interest in FET.
- Technical indicators turn positive as FET reclaims the 20-day EMA, suggesting a shift from bearish to short-term recovery.

Artificial Superintelligence Alliance (FET) is showing early recovery signs after a long downtrend, with improving momentum and rising buying pressure for the FET price. Increased trading activity and market participation support a potential continuation. A breakout above key resistance could strengthen the bullish trend and open room for further upside.
At the time of writing, FET is trading at $0.2111 with a 24-hour trading volume of $236.31 million and a market capitalization of $476.8 million. Following the 8.19% gain over the last 24 hours, FET is poised for a strong breakout ahead.
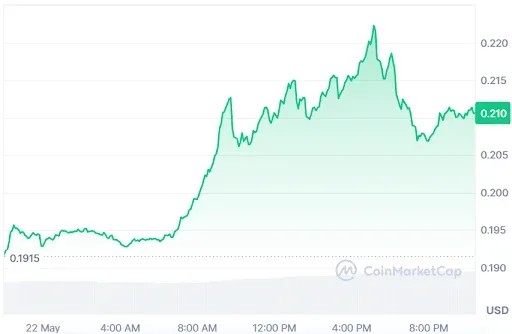

Source: CoinMarketCap

FET Price Breakout Could Ignite Next $0.55 Rally
According to the crypto analyst World Of Charts, FET is attracting renewed market attention after remaining stuck in a prolonged downtrend for months. The FET price is now testing a major resistance zone, with analysts closely watching for a potential breakout.
Growing momentum around AI-focused digital assets has also fueled optimism that the FET price could soon reverse its bearish structure completely.
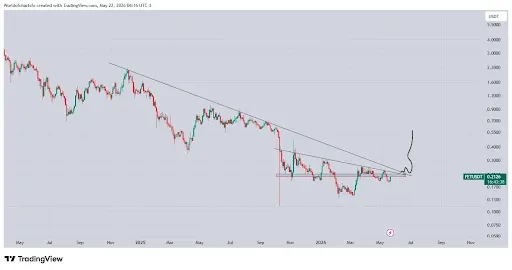

Source: World Of Charts’ X Post
Traders are on the lookout for a proven breakout, accompanied by strong volumes, which can drive an impressive bull run for the FET price in the coming days.
The estimated upside on the back of this breakout, according to the FET price forecasts, would be about $0.55. Until then, traders have been advised to remain patient and wait for developments.
Also Read: FET Price Outlook: Can Buyers Break Resistance and Reach $0.60?
Technical Indicators Point to a Recovery Attempt
According to TradingView, the FET price generated a bullish signal with the formation of a daily bullish candle and managed to rise to $0.21062, gaining 8.68%.
The gain helped the FET price surpass the 20-day EMA level at 0.20670. However, there are new challenges for FET coming as it faces headwinds at the 50-day and 100-day EMAs, along with the 200-day
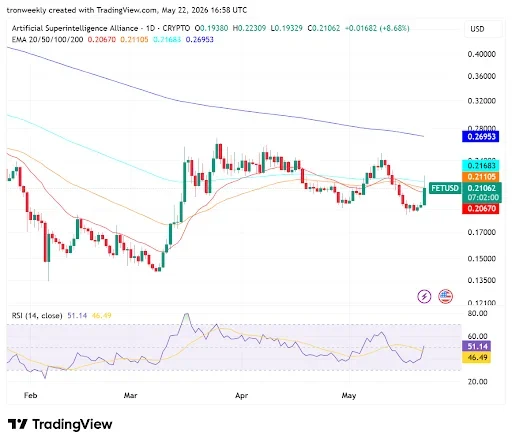

Source: TradingView
Below the price action, the Relative Strength Index (14) has risen slightly to reach the level of 51.14, crossing the yellow signal line.
An entry in positive numbers is an indication of rising buying pressure and an emerging upward trend after reaching troughs. To sustain the breakout, the bulls need to move above the group of moving averages.
FET Derivative Data Support Upward Potential
However, the open interest for the FET surged around 21.60% to reach an amount of $84.39 million. This is a clear indication that more traders have started coming into play with new trades being undertaken, implying speculation in the derivatives space.
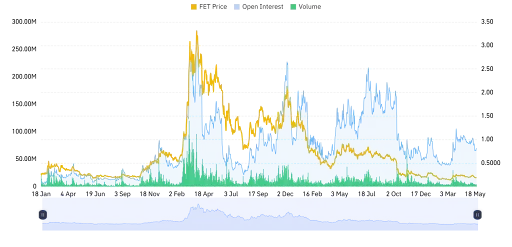

Source: Coinglass
There is an increase in volume of 149.28%, amounting to $153.62 million. It suggests that there is considerable trading action and trader participation in the market, hence indicating the presence of liquidity flows.
This article contains market analysis and price predictions. These are not guarantees. Crypto markets are volatile. Always DYOR. Not financial advice.
Also Read: FET Price Prediction: Bull Flag Pattern Points to Possible Breakout to $0.2350

Be the first to comment