
Ethereum’s supply structure has rarely looked more favorable on-chain. Staked ETH is at an all-time high, Binance depositors are quiet, and Realized Cap is rising, but the the price is 5.5% down for the week.
Key Takeaways
- ETH trading at $2,066, intraday low $2,009: Fibonacci 0.786 at $2,051 held on close.
- Fibonacci levels broken sequentially: 0.236, 0.382, 0.5, 0.618, 0.786 tested.
- Break below $2,000: next levels $1,938 (Fib 1.0), then $1,900 and $1,740.
- RSI at 31.60, approaching oversold on daily: momentum deteriorating but slowing.
Ethereum is trading at $2,066 on the daily chart as of May 23, having touched a session low of $2,009 before recovering above the Fibonacci 0.786 level at $2,051. Three on-chain metrics are read alongside the price structure to determine whether the current decline is a correction or the beginning of distribution.
How the Fibonacci Grid Got Here
The decline from the $2,465 peak has moved through the Fibonacci grid level by level. Price lost the pink zone above $2,340, broke through the orange zone between $2,264 and $2,340, failed to hold the green zone around $2,201, and declined through the teal zone between $2,139 and $2,201. The current session is testing the light blue zone between the 0.618 at $2,139 and the 0.786 at $2,051, with the intraday low penetrating below the 0.786 before recovering.
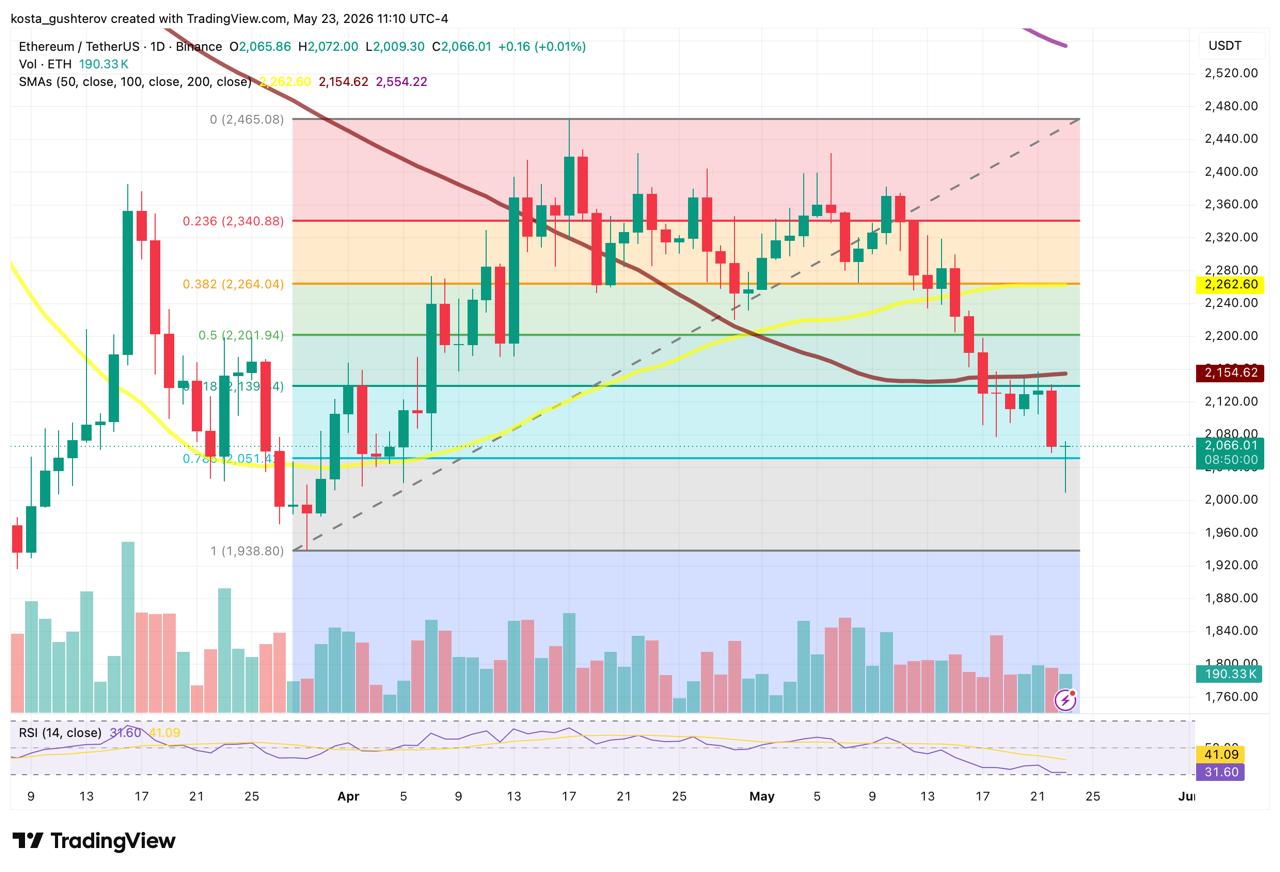
Ethereum’s intraday low of $2,009.30 penetrated the Fibonacci 0.786 at $2,051.40 by $42 before recovering above it, which means the level has been tested from below and held on a closing basis, adding structural weight to the zone while simultaneously demonstrating that sellers have the momentum to reach it. Analytically, $14.61 separates current price from the 0.786 level, representing less than 0.7% of current price, meaning a sub-1% daily decline brings the level back into direct contact without requiring any structural deterioration beyond what the session already shows.
What Is Below $2,000
The Fibonacci full retracement at $1,938.80 is the chart’s next labeled support below $2,000, which means a break below the psychological level does not find the next structural reference until $1,938.80, a gap of $61.20 with no labeled intermediate support. The $2,000 level itself sits $66 below current price and $9.30 above the session’s intraday low. The user-identified levels below $1,938.80 are $1,900 and $1,740, both analytically derived from prior price structure rather than labeled on the current Fibonacci grid.
All three moving averages are declining above current price. The SMA100 at $2,154.62 sits $88 above current price. The SMA50 at $2,262.60 sits $196 above. RSI at 31.60 with signal at 41.09 is approaching but not yet at the oversold threshold of 30. The 9.49-point spread confirms momentum remains negative while the proximity to 30 suggests the pace of decline may be approaching a mechanical limit on the daily timeframe.
What the On-Chain Data Says About the Decline
Staked ETH at all-time highs heading into 2026 while Binance depositor activity remains suppressed describes a supply structure where the available-for-sale float is contracting from one direction while distribution pressure is not expanding from the other, and that combination is what the source identifies as the condition that makes pullbacks buying opportunities rather than distribution events. CryptoQuant’s analysis notes that previous spikes in Binance depositor activity preceded weaker price momentum, and the current absence of such a spike while staking continues rising is the structural distinction between the current correction and a distribution event.
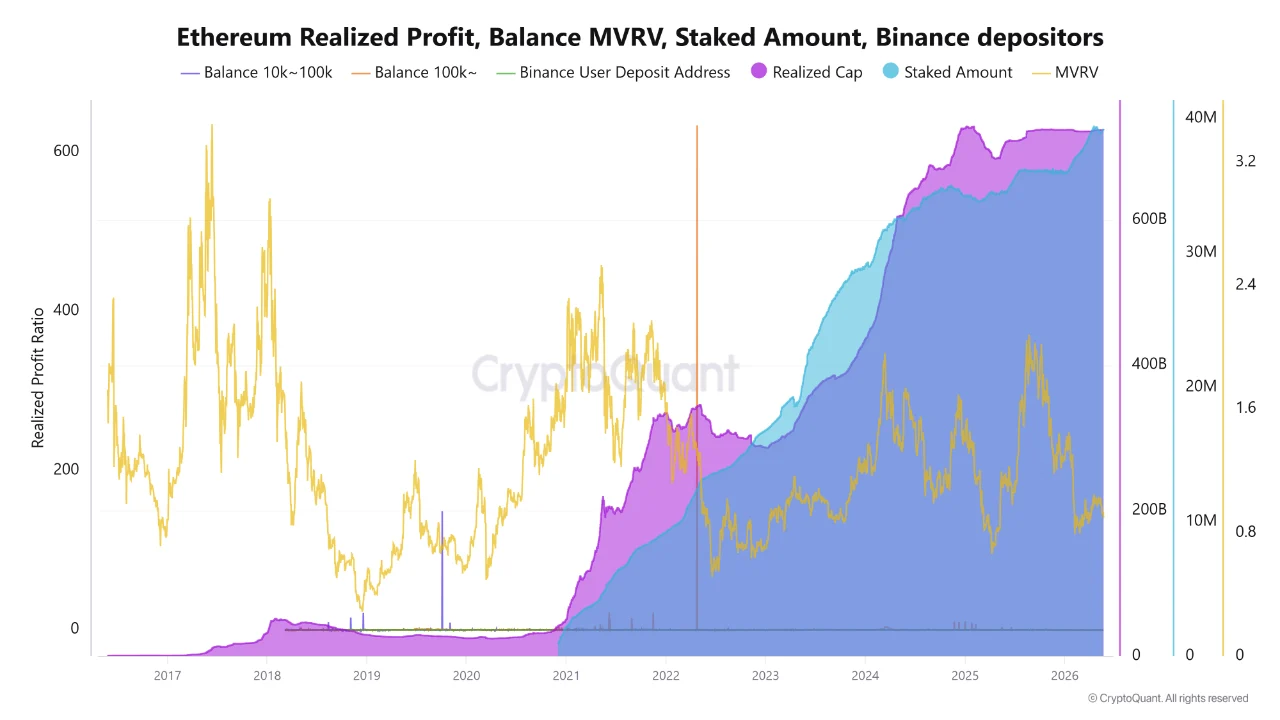
Realized Cap continuing to rise while price corrects analytically suggests capital is entering Ethereum at current cost basis levels, meaning new buyers are establishing positions even as market price declines, though the source’s characterization that this is “typically seen during late stage bull cycles rather than bear markets” is the source’s own framing rather than a verified causal claim. MVRV is elevated but far from the overheated readings seen at previous cycle tops, which the source reads as the long-term trend remaining intact while temporary corrections remain possible.
A daily close back above the SMA100 at $2,154 on expanding volume within the next five sessions would begin repairing the Fibonacci structure and confirm the on-chain supply thesis. A daily close below $2,000 with Binance depositor activity beginning to rise would invalidate the suppressed-distribution reading and bring the $1,938 full retracement into immediate focus.
The information provided in this article is for educational purposes only and does not constitute financial, investment, or trading advice. Coindoo.com does not endorse or recommend any specific investment strategy or cryptocurrency. Always conduct your own research and consult with a licensed financial advisor before making any investment decisions.

Kosta has reported on cryptocurrency markets and blockchain infrastructure since 2020, bringing over six years of hands-on experience in the crypto industry built through daily tracking of markets, trends, and emerging blockchain developments. Specializing in Bitcoin on-chain analysis, institutional ETF flows, and digital asset price action, his work at Coindoo has been cited by other news agencies and consistently covers market developments with a focus on data-driven reporting across Bitcoin, Ethereum, Solana, and XRP.
Over the years, Kosta has contributed to multiple crypto media outlets in different regions, authoring over 6,000 articles across the sector. His reporting spans cryptocurrency markets and the broader fintech industry, tracking not only price action but also the technological and regulatory forces shaping the ecosystem.
To support his analysis, Kosta actively leverages on-chain data and metrics from leading platforms such as Santiment, Glassnode, and CryptoQuant, enabling deeper, evidence-based market insights. He believes in the power of transparency and the data that underpins the blockchain ecosystem.
His academic background in Marketing Management from Denmark further complements his analytical approach, adding a strong understanding of communication strategy and content positioning to his work.

Be the first to comment