


TLDR
- SOL is trading near $82, down roughly 70% from its all-time high near $295
- Key short-term resistance sits at $95 — a weekly close above it would signal a relief move
- Immediate support holds between $78–$83; a break below could expose $60
- The 50-week EMA near $124 remains a firm overhead barrier for any broader recovery
- Daily trading volume rose 10% to $3.89 billion despite the price drop, pointing to active selling
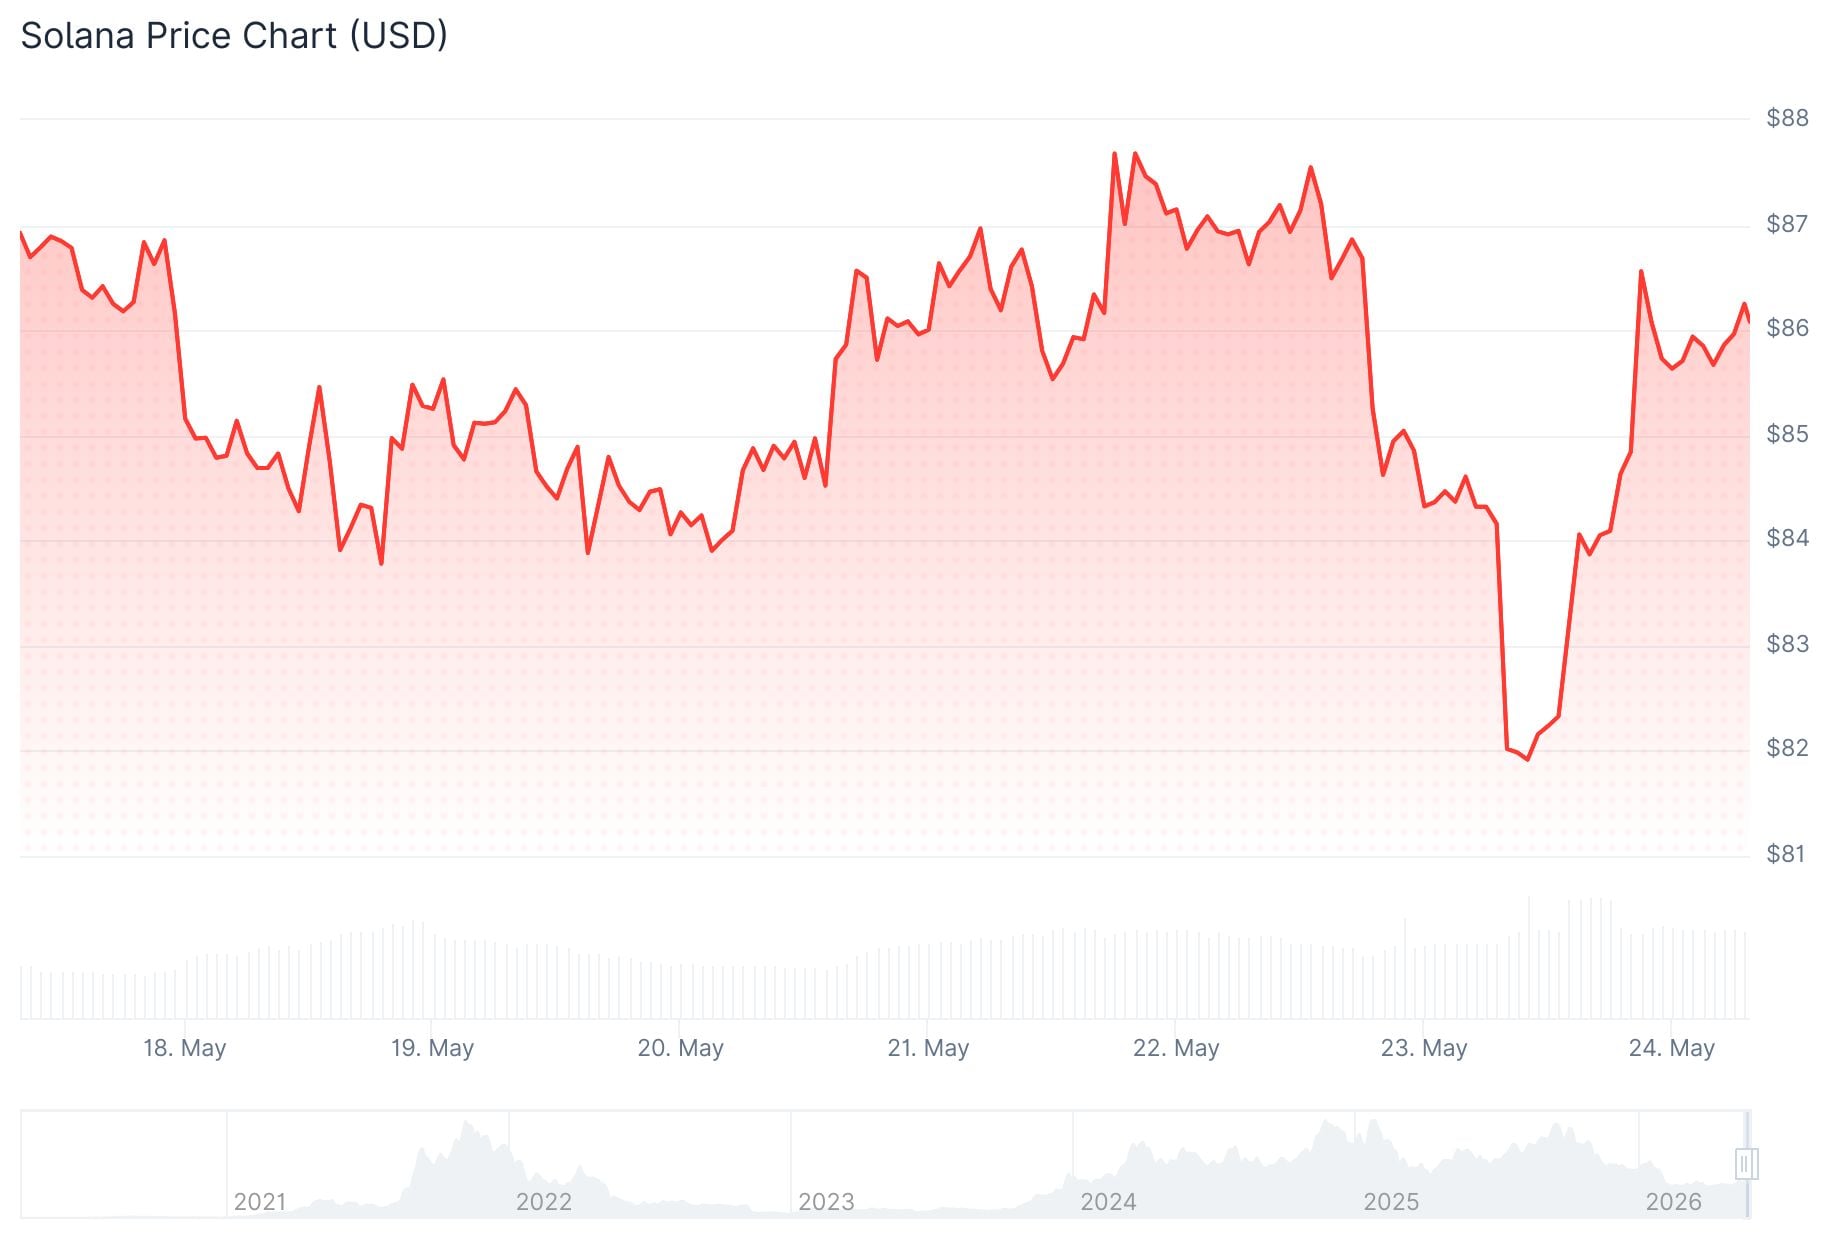
Solana is stuck in a difficult spot right now. The token has been trading around $82 on the daily chart and $86 on the weekly view, sitting well below the dotted support zone near $95 that traders have been watching closely.
The drop from its prior high near $295 has been steep — about 70% — and market sentiment reflects that pain. Crypto analyst Whale Watch put it plainly on social media: “Everyone loved SOL at $295. Nobody wants it at $86.” That tweet captures the current mood well. It points to weak demand during a sharp correction, a pattern often seen in deep pullbacks where retail interest dries up precisely when prices are at their lowest.
🐋 WHALE WATCH: Everyone loved $SOL at $295. Nobody wants it at $86. This is usually how the market works.
Right now $SOL is trading at $86.83 on the weekly chart. That is 70% below the previous high.
We are sitting just under the dotted support zone around $95.
The technical… pic.twitter.com/cvINrMzDgS
— Whale Factor (@WhaleFactor) May 22, 2026
Buyers have defended the $78–$83 range for now, but momentum is thin. A weekly close below $83 would weaken the current setup.
What the Charts Are Saying
Analysts at Elliott Wave Academy believe SOL may be forming a short-term corrective rebound. Their analysis points to a possible move toward the 50%–61.8% retracement of the previous decline, with room to extend toward the 78.6% level if buying picks up. But they caution that how price reacts near those levels will determine what comes next.
$SOL Is Sitting At The Exact Buy Zone That Sent It Flying 2,200% Last Cycle
Is $1,000 SOL Loading For Alt Season?
NFA & DYOR#SOLANA @solana pic.twitter.com/bdibRy8WWJ
— Crypto Patel (@CryptoPatel) May 23, 2026
Analysts from MCO Global DE describe recent price moves as mostly “noise,” with no confirmed breakout in either direction. They place immediate support at $81.28, with a stronger support band between $71.92 and $77.96. Those zones have absorbed selling pressure during recent pullbacks. The firm also warns that another short-term dip is possible before any larger recovery attempt takes shape.

The moment of truth for $ETH and $SOL is close.
A strong bounce back from this trendline, and a good rally will happen.
Lose this trendline, and new lows will happen quickly. pic.twitter.com/WnUWMntRa8
— Ted (@TedPillows) May 23, 2026
For any sustained recovery, SOL needs to clear $95 first. After that, attention would shift to the 50-week EMA near $124, which has acted as firm resistance since SOL lost it earlier this year. A close above $124 would open room toward $175 and $200.
Trading Volume Points to Active Selling
CoinMarketCap data shows SOL trading at $82.21, down 5.83% in the past 24 hours. Market cap sits at $47.51 billion. Daily trading volume rose 10.04% to $3.89 billion.
The rise in volume during a price drop is worth noting. It typically indicates active selling rather than a quiet consolidation. Resistance sits in the $90–$95 zone on the short-term chart.
The key technical barrier at $96 remains unbroken. Until buyers reclaim that level convincingly, the market structure is expected to stay neutral.
Analysts also point to $110 as a longer-term resistance zone that could define whether Solana enters a true trend reversal or stays range-bound.
SOL now trades near $82.21, with support at $80 and resistance between $90 and $95.

Be the first to comment