


What to know:
- BNB shows accumulation near $650, signaling bullish reversal with long-term targets of $2,000, $3,000, and $5,000.
- MACD crossover and Bollinger Band compression suggest fading bearish pressure and rising momentum for Binance Coin.
- BNB consolidates below 20-week SMA resistance, with a breakout potentially confirming the next major upward cycle.

Binance Coin (BNB) shows accumulation and consolidation with improving momentum as bearish pressure fades, volume strengthens, and derivatives exposure cools. Technical signals suggest a potential early recovery phase for the BNB price with a possible breakout into higher long-term cycle targets if market conditions remain supportive.
At the time of writing, BNB is trading at $651.45 with a 24-hour trading volume of $1.26 billion and a market capitalization of $87.81 billion. Despite the signs of stability over the last 24 hours, the BNB price could move to new highs if market pressure eases.
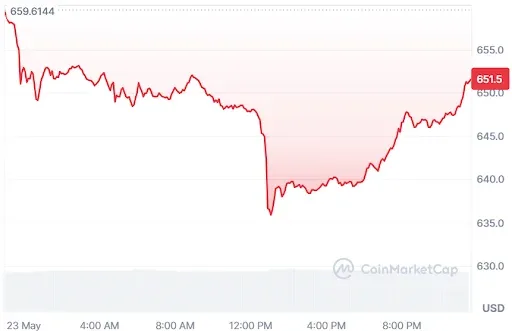

Source: CoinMarketCap

BNB Price Accumulation Signals $5,000 Bull Run Potential
Furthermore, the crypto analyst Crypto Patel pointed out that the BNB price chart is showing a strong long-term accumulation structure as price consolidates within a broad range, with traders viewing the $500 to $300 zone as a potential base for future expansion.
Market participants believe this phase reflects steady absorption of supply, often seen before major bullish cycles in large-cap crypto assets like BNB.
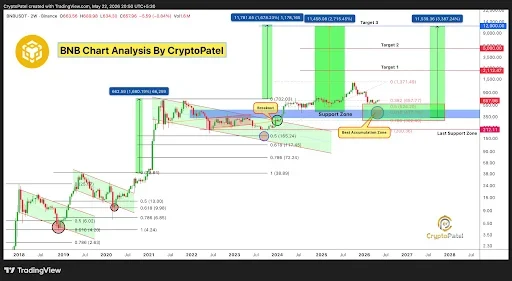

Source: Crypto Patel’s X Post
In the case of optimistic expectations, a steady climb is anticipated to occur rather than a sudden jump, with the targets for the BNB price being set at $2,000 first, followed by $3,000 and ultimately $5,000.
However, these are merely expectations, dependent on broader market conditions and the achievement of a breakout from key resistance.
Also Read: BNB Price Targets $663 Breakout as BNBAgent SDK Boosts Sentiment
MACD Bullish Crossover Point to Improving Outlook
According to TradingView, the BNB price has been consolidating around $650.86 following a pullback from its 2024 high above $1,200.
The BNB price is currently trading below its 20-week SMA at $674.42, trapped within the Bollinger Bands, where the upper and lower bands are priced at $877.24 and $471.60, respectively.
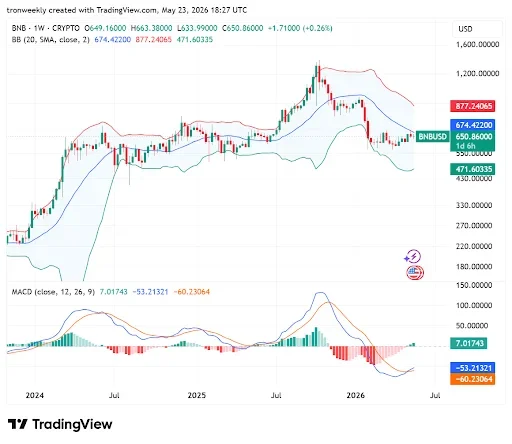

Source: TradingView
The MACD indicator is showing that sellers have become exhausted and that momentum is changing. The MACD indicator is curling upwards towards the signal line as its value stands at -53.21 and that of the signal line at -60.23. The histogram has changed from being red to green, with the value of 7.01.
BNB Rising Volume Support Upward Potential
However, BNB’s trading volume increased by 18.72%, amounting to $816.17 million. This marks the presence of more aggressive trading behavior and indicates a higher participation rate, suggesting that there is enough liquidity for trading.
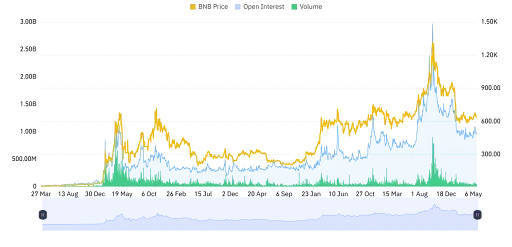

Source: Coinglass
The open interest dropped by 3.53% to reach $964.17 million. The decline indicates that there are fewer derivative positions open, which means less market commitment. The decline could be due to profit-taking or caution among traders.
This article contains market analysis and price predictions. These are not guarantees. Crypto markets are volatile. Always DYOR. Not financial advice.
Also Read: BNB Chain Unleashes Binance x402 as AI Spending Nears $2.5T in 2026

Be the first to comment