


What to know:
- XTZ remains bearish as the price trades below key EMAs, while weak RSI and low volume signal fading bullish momentum.
- Analysts believe XTZ could be in a long-term accumulation zone between $0.20 and $0.16 ahead of a possible reversal.
- A breakout above $0.6418 may trigger a strong Tezos recovery, with targets at $1.30, $4, and potentially $10.

Tezos (XTZ) remains in a strong bearish trend, though analysts see signs of accumulation by long-term buyers. Weak RSI, declining volume, and falling open interest reflect cautious sentiment, while a breakout above key resistance could indicate the start of a potential recovery for the XTZ price.
At the time of writing, XTZ is trading at $0.3365 with a 24-hour trading volume of $9.54 million and a market capitalization of $365.32 million. After the loss of 1.37% over the last 24 hours, the question is whether the token could maintain its bullish recovery or lead to deeper retracements.

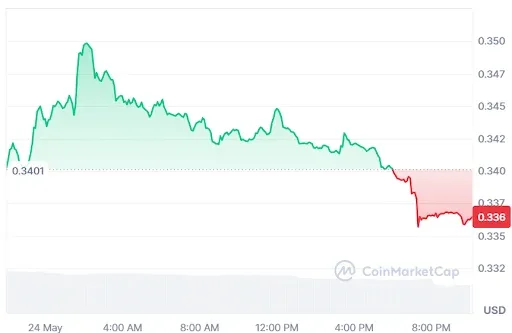
Source: CoinMarketCap

XTZ Price Accumulation Signals Potential Reversal
Furthermore, the crypto analyst Crypto Patel revealed that the XTZ price has dropped nearly 96% from its $9.17 all-time high, now hovering around $0.34 after prolonged bearish pressure.
Price action suggests a possible accumulation range between $0.20 and $0.16, where long-term buyers may be quietly absorbing supply. However, the broader trend remains bearish, with confirmation still absent.
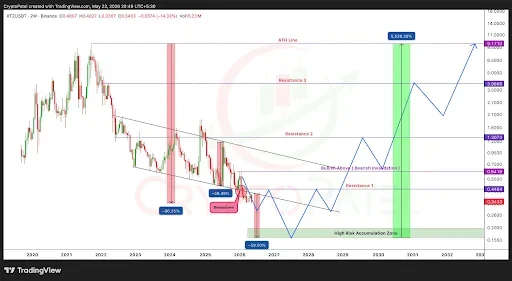

Source: Crypto Patel’s X Post
The bullish trend reversal will come only if the price closes above $0.6418. It opens the doors to profit at $1.30, $4, and even $10, indicating a possible 5,500% increase.
However, the trade remains risky if the XTZ price falls below $0.17 because this invalidates the pattern. Meanwhile, the best approach is to be patient, as trend reversal cycles tend to begin unnoticed during the accumulation phase.
Also Read: Top 5 Budget-Friendly Cryptos: Jupiter (JUP), Tezos (XTZ), PNUT, and More Primed for a Bullish Run
RSI and EMAs Point to Strong Bearish Dominance
According to TradingView, the XTZ price is being influenced by a strong bearish momentum on a macro level. Currently, the XRZ price stands at $0.33555.
The XTZ price is moving downwards, constrained by a bearish EMAs pattern. The two EMAs, the 20-day EMA of $0.35588 and the 50-day EMA of $0.36559, make up a strong resistance level, whereas the 200-day EMA confirms long-term seller dominance.


Source: TradingView
XTZ is floating like a duck on water near an important horizontal support level of $0.33000, retesting the March lows.
The momentum remains weak, as per the RSI, which is hovering close to a dull level of 39.72, marginally below the yellow line on the chart. A lower reading below 50 means that there is continued downward pressure.
XTZ Derivative Data Point to Decreasing Strength
However, the XTZ open interest dropped by 1.89% to hit $13.13 million. This is an indication that some investors are exiting their current positions instead of entering new trades, suggesting reduced optimism in the market.


Source: Coinglass
The trading volume is down by 44.63% to $8.73 million. This decline suggests low levels of participation and low liquidity, which could be indications of a conservative attitude of the investors.
This article contains market analysis and price predictions. These are not guarantees. Crypto markets are volatile. Always DYOR. Not financial advice.
Also Read: Tezos (XTZ) Falling Wedge Signals Potential Bullish Reversal Toward $7.960

Be the first to comment