


What to know:
- XRP price shows short positions closing as open interest declines in futures trading.
- Lower timeframe structure still reflects bearish control despite short-term stabilization.
- Long-term charts continue to show a potential breakout setup if key levels break.

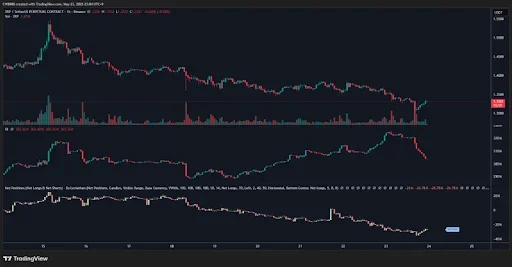
The recent XRP price movement shows a shift in futures positioning as open interest declines while net position delta rises, based on data shared by trader CW.
This pattern suggests that many traders are closing short positions after extended bearish pressure, leading to a temporary change in market balance.
As seen on Binance’s hourly chart for the perpetual futures contract of XRP, the crypto rallied towards the $1.53-$1.55 zone on or about May 15 and quickly retreated due to aggressive selling and forming a local top.

From that point forward, XRP showed bearishness with decreasing prices marked by lower lows and lower highs. Volume is supportive of bearishness, as the crypto registered major sell-offs following its peak on May 18 and May 23.

Source: X
Also Read: ROSE Price Analysis: Consolidation Hints at an Explosive Breakout Rally to $1
Open Interest Signals Shift in XRP Market Behavior
Open interest can be used to explain the existing XRP price level. Specifically, between May 20 and May 23, there was an increase in open interest, despite the fall in the XRP price. This means that short positions started accumulating.
The open interest figure has gone down significantly, even though the XRP price is holding at $1.32. This indicates that the bears are covering their positions rather than taking new positions.
This could cause a bounce in the near future, but the trend is not going to change since the general net position is still very bearish. The bullish momentum is seen to have slightly improved.
Long-Term XRP price Structure Still Points to Breakout Potential
While the short-term chart might seem bearish, the focus is still on the long-term prospects of the XRP price despite the two-week analysis conducted by JD. The chart reveals a massive symmetrical triangle formation from the 2018 high, within which is a falling wedge formation.


Source: X
For years now, the XRP price has been caught between decreasing resistance levels and increasing support levels, leading to lower volatility. Generally, when such price setups occur, they end up being associated with volatile price movements.
This particular setup occurs within the bigger picture, which includes the falling wedge pattern that has another potential bullish pattern embedded in it. Due to the tight squeeze of XRP price action, it is reported that the downward momentum in the wedge pattern is declining.
This article contains market analysis and price predictions. These are not guarantees. Crypto markets are volatile. Always DYOR. Not financial advice.
Also Read: DASH Price Breakout Point to $1,700 Rally After Falling Wedge Formation
Be the first to comment