



Signal of the week: The short-term holder cost basis crossed below Bitcoin’s true mean price — this crossover preceded drops of 21% in 2018 and 34% in 2022 within a single week. Bitcoin trades in a lower-volatility environment today, but it could still reinforce a deeper correction.
Several weeks of building pressure broke through. The index jumped back into High Impact territory for the first time since March, driven by a collapse in short-term holder profits, one of the largest ETF outflows in 2026, and a stablecoin drain that signals buyers are stepping away. The crossover signal in the background adds an uncomfortable historical context to what might come next.
About the Bitcoin Impact Index
The Bitcoin Impact Index measures which groups of Bitcoin holders are under financial stress, how severe that stress is, and whether it’s severe enough to shake confidence in the market’s direction. It combines on-chain holder behaviour, ETF and derivatives activity, and exchange-level liquidity flows into a single weekly score between 0 and 100. Unlike sentiment indicators, it deliberately excludes social media and volume data to focus on what participants are doing rather than what they are saying.
Score bands:

- Normal Rotation (0–24) — routine profit-taking, no structural shift
- Elevated Repositioning (25–49) — specific groups shifting positions, pressure uneven across the market
- High Impact (50–74) — broad stress across multiple holder groups and institutional flows simultaneously
- Critical Impact (75–100) — full capitulation: LTH losses, large ETF outflows, major liquidations, and heavy exchange inflows at once
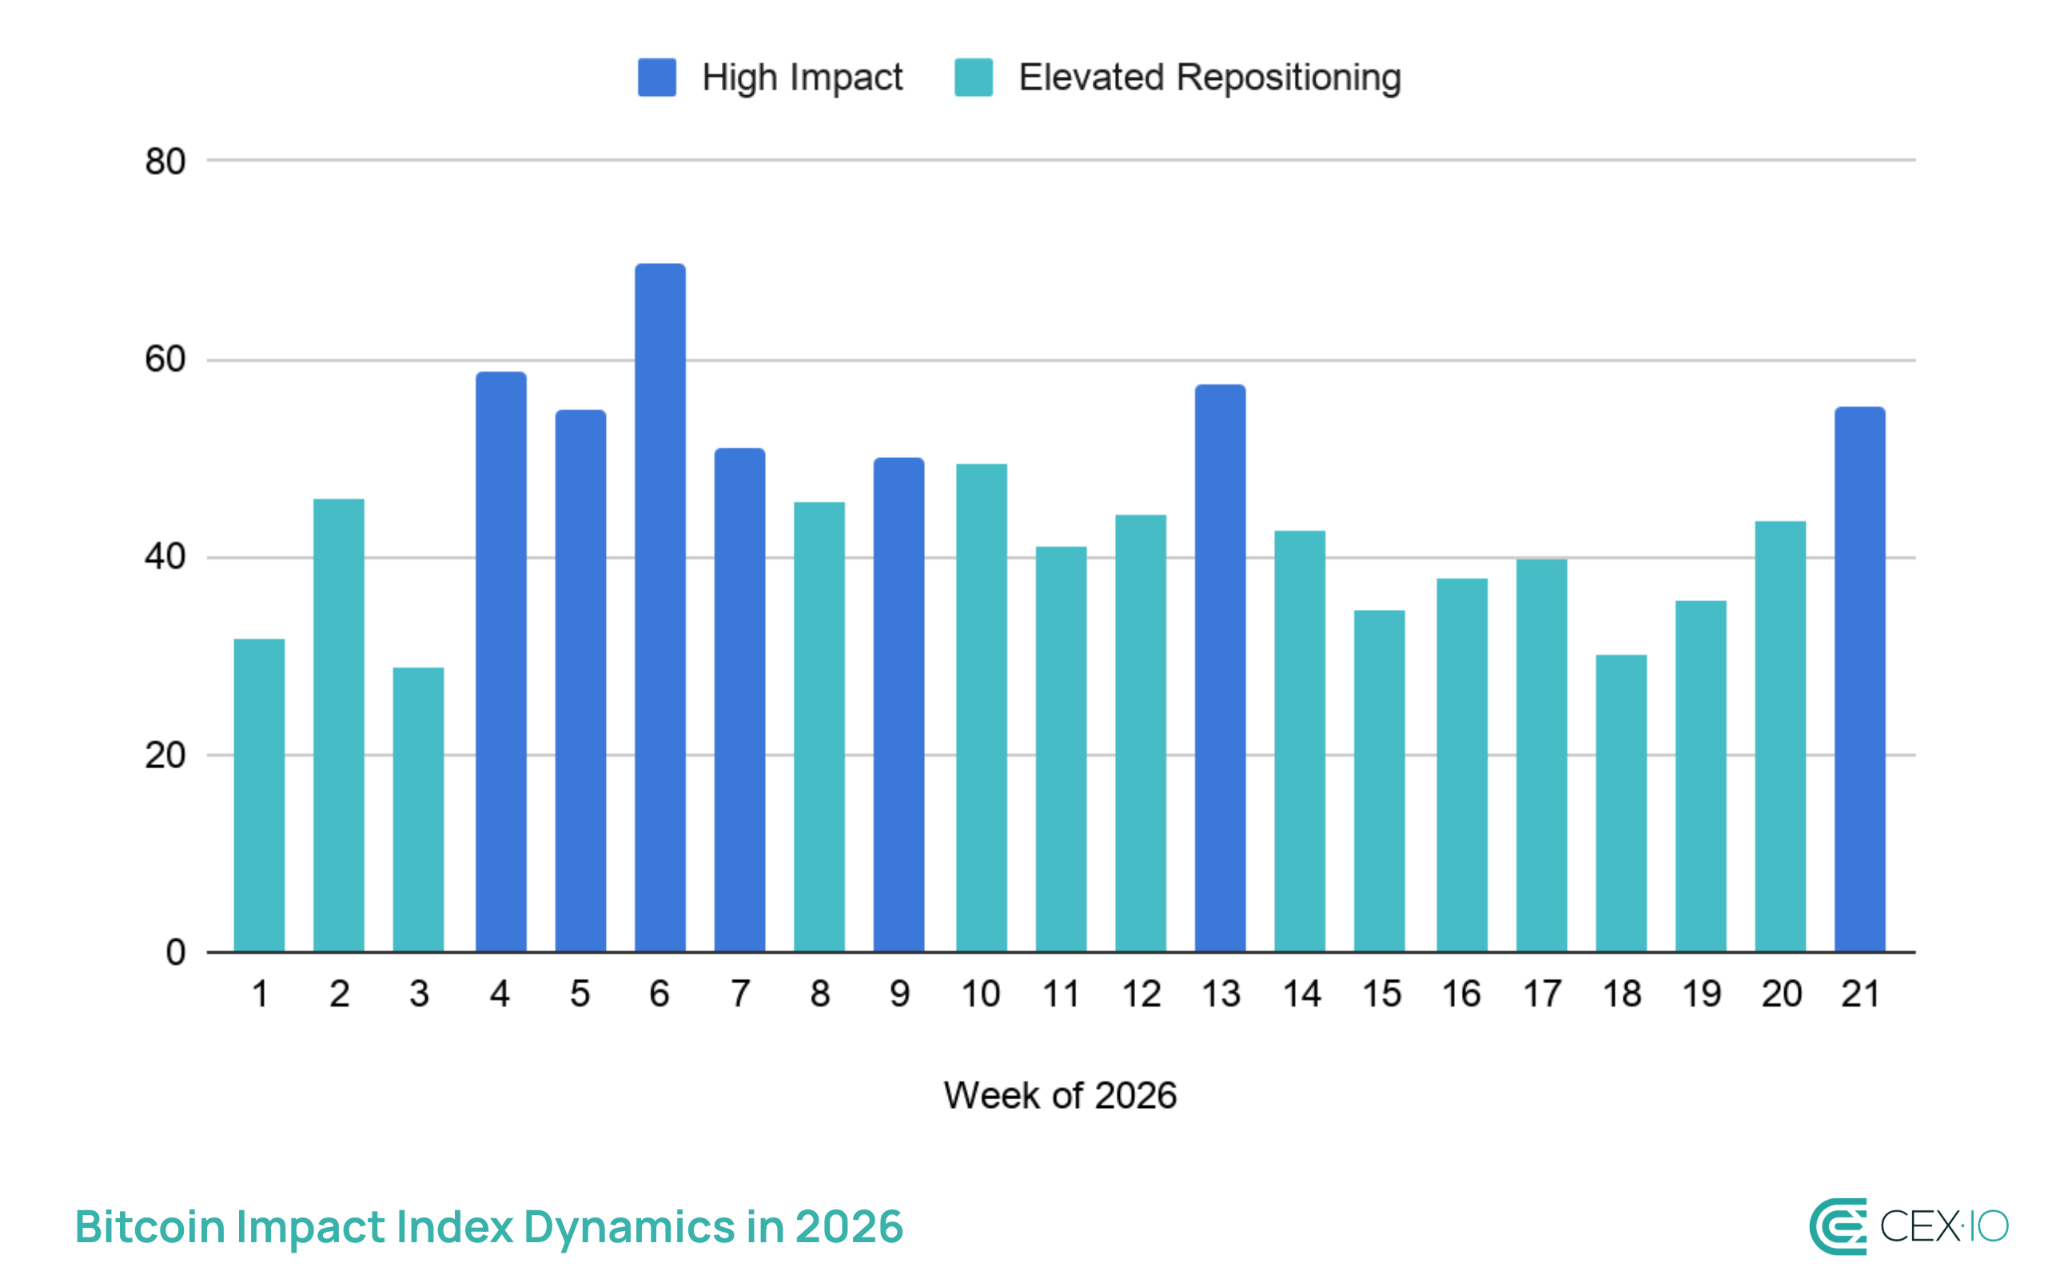
Week 21 (May 18–24): BII 55.2 — High Impact
Negative signals: everything moved in the wrong direction at once
Short-term holders went from barely in profit to deeply underwater in a week. Their realized P/L experienced a single-week deterioration that matches the scale of the drops seen in the most stressed weeks of January and February. As a result, recent buyers who had been holding on at breakeven are now sitting on meaningful losses, and when they slip underwater, they tend to sell.
Stablecoins registered –$332 million daily average in exchange netflows, meaning that the buyers who would typically step in to absorb selling pressure were not arriving. Also, leveraged longs continued to bear the brunt of derivatives stress, with long liquidations making up 82% of total, with bullish leveraged positions being systematically wiped out.
Negative signals: a historical warning pattern just appeared
The short-term holder cost basis crossed below Bitcoin’s true mean price, and this crossover historically occurred in the middle of previous bear markets before every major leg down:
- In 2014, a similar crossover preceded a 20% weekly drop.
- In 2018, it preceded a 21% weekly drop.
- And in 2022, it preceded a 34% weekly drop.
If Bitcoin repeats this pattern in full, this suggests that the asset may retest $60,000 in the short-term. However, Bitcoin runs at considerably lower volatility in this cycle, so a repeat of those magnitudes is unlikely. But the direction of the signal has been consistent: this crossover has historically meant that the market’s structural support has shifted from holding to giving way.
Moreover, the significance is not the precise percentage. It is that the average recent buyer is now underwater relative to a long-term valuation anchor, which historically creates a self-reinforcing dynamic where falling prices force more selling, which pushes prices lower.
Mixed signals: long-term holders are still buying — but slowing down
Long-term holders added around 30,000 BTC last week. That continues the accumulation streak that has run for months, but it is a notable step down from the 80,000 BTC added the week prior and the record additions seen through April. LTH SOPR edged slightly lower to 0.871, indicating that long-term holders continue accumulating while being increasingly underwater.
Funding rates turned slightly positive this week, meaning the extreme short positioning that dominated through spring has fully unwound. Leveraged traders are no longer aggressively betting against Bitcoin. That removes one potential upside catalyst — a short squeeze — from the near-term picture.
What could happen next
Considering deteriorated on-chain metrics and historical context, the path of least resistance appears to be downwards. Bulls might still try to reclaim the true mean price and short-term holder cost basis at $78,000, or even test the 200-day moving average at $80,000 in the coming days. But if their run fails, this could reinforce deeper correction.
For bears, the immediate target is $74,500, where the 128-day moving average sits. A clean break below that level would remove a key support and reestablish the kind of downward momentum not seen since February. If that gives way, the next meaningful level is $70,000.
As such, the historical crossover signal, two consecutive weeks of record ETF outflows, and a stablecoin drain all point toward continued downward pressure in the near term. Long-term holder accumulation and a low sell-side risk ratio are the main structural counterweights. Whether those counterweights are sufficient to reclaim $78,000 — or whether this week marks the beginning of a more sustained leg down — might be decided quite rapidly.
The web content provided by CEX.IO is for educational purposes only. The information and tools provided neither are, nor should be construed as, an offer, or a solicitation of an offer, or a recommendation, to buy, sell or hold any digital asset or to open a particular account or engage in any specific investment strategy. Digital asset markets are highly volatile and can lead to loss of funds.
The availability of the products, features, and services on the CEX.IO platform is subject to jurisdictional limitations. To understand what products and services are available in your region, please see our list of supported countries and territories. This page includes additional links to information about individual products, and their accessibility.



Be the first to comment