


Warner Windom Brackett was born in Ridgewood, NJ in 1914 and graduated from the
New York Military Academy in 1932. He voluntarily enlisted into the Army’s Cavalry and training at Ft. Riley, KS eventually earning the rank of Captain. He served in the (86th. Division) in the Ruhr Pocket in March of 1945 and liberated the Attendorn civilian forced labor camp in Germany. A civilian and inactive reservist he received a letter (1951) asking if he was willing to again serve in the Army. He volunteered and as a Captain was then deployed to South Korea for eight months.
My mother, Ruth Foster Brackett, spent many years volunteering at several charitable organizations and decided in 1943 to volunteer to work at the American Red Cross. She trained at Bellevue Hospital, NYC, NY and at their main headquarters in Washington, DC with assignment as a Hospital Recreation Aid. Her deployment overseas during wartime meant she was given the rank of Second Lieutenant in the case she was ever captured! She left from Texas and spent 1 year in US hospital outside Paris, France. Before her return to the States she met Warner,
a childhood friend, for a visit in Paris. They eventually got married in September 1946!

Welcome to this week’s publication of the Market’s Compass Crypto Sweet Sixteen Study #243. The Study tracks the technical condition of sixteen of the larger market cap cryptocurrencies. Every week the Studies will highlight the technical changes of the 16 cryptocurrencies that I track as well as highlights on noteworthy moves in individual Cryptocurrencies and Indexes. Past publications including the Weekly ETF Studies can be accessed by paid subscribers via The Market’s Compass Substack Blog.
An explanation of my objective Individual Technical Rankings and Sweet Sixteen Total Technical Ranking go to www.themarketscompass.com. Then go to the MC’s Technical Indicators and select “crypto sweet 16”. What follows is a Cliff Notes version* of the full explanation…

*The technical ranking system is a quantitative approach that utilizes multiple technical considerations that include but are not limited to trend, momentum, measurements of accumulation/distribution and relative strength. The TR of each individual Cryptocurrency can range from 0 to 50. The Sweet Sixteen Total Technical Ranking or “SSTTR” is the sum of the sixteen individual TRs and can be viewed as an overbought / oversold indicator as well as a confirmation / non-confirmation indicator.
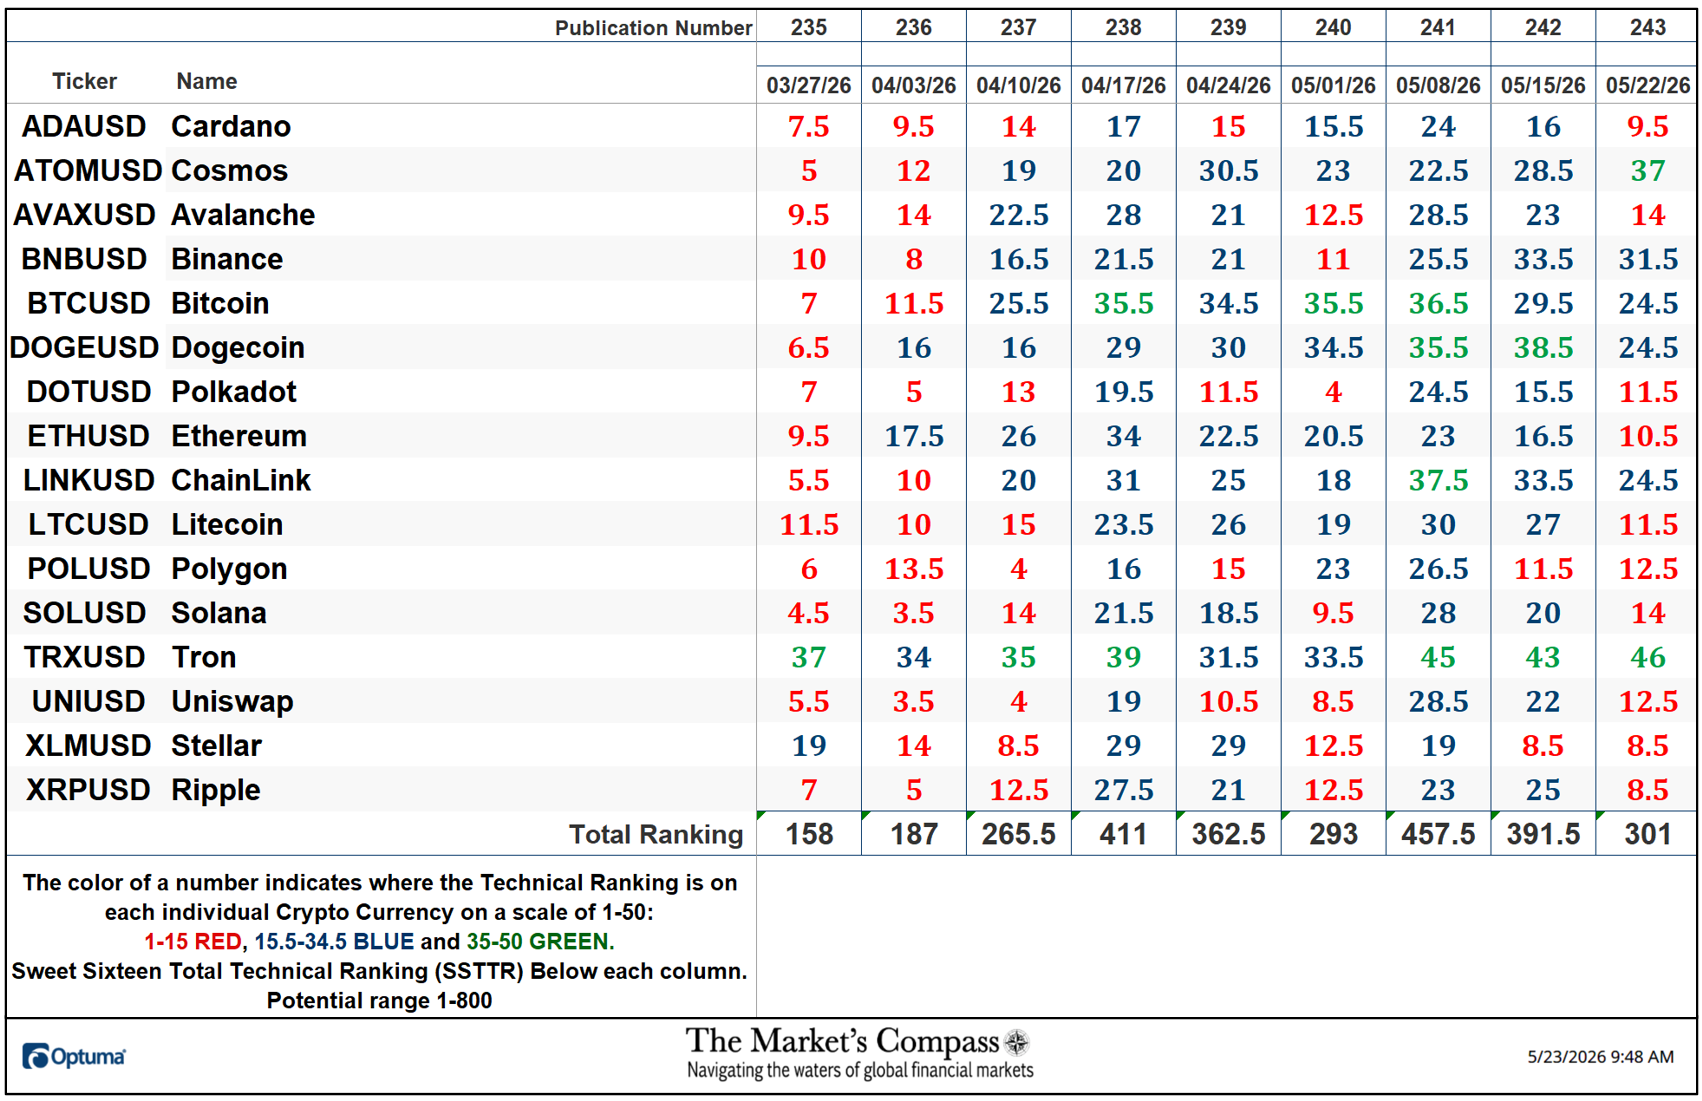
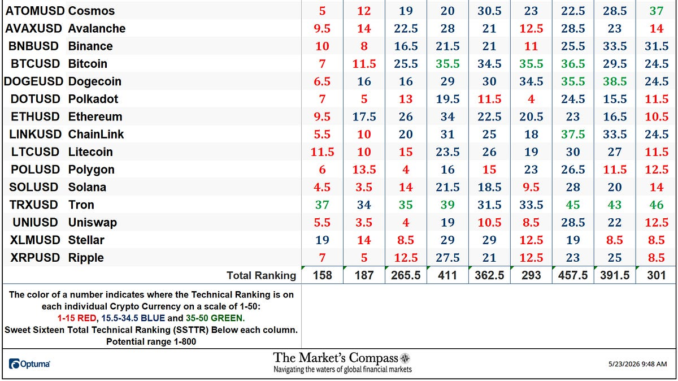
The Sweet Sixteen Total Technical Ranking fell back for the second week in a row, down 23.12% to 301 after falling 14.43% the week before to 391.5 last week from 457.5 three weeks ago, which was the highest reading in the SSTTR since October of last year.
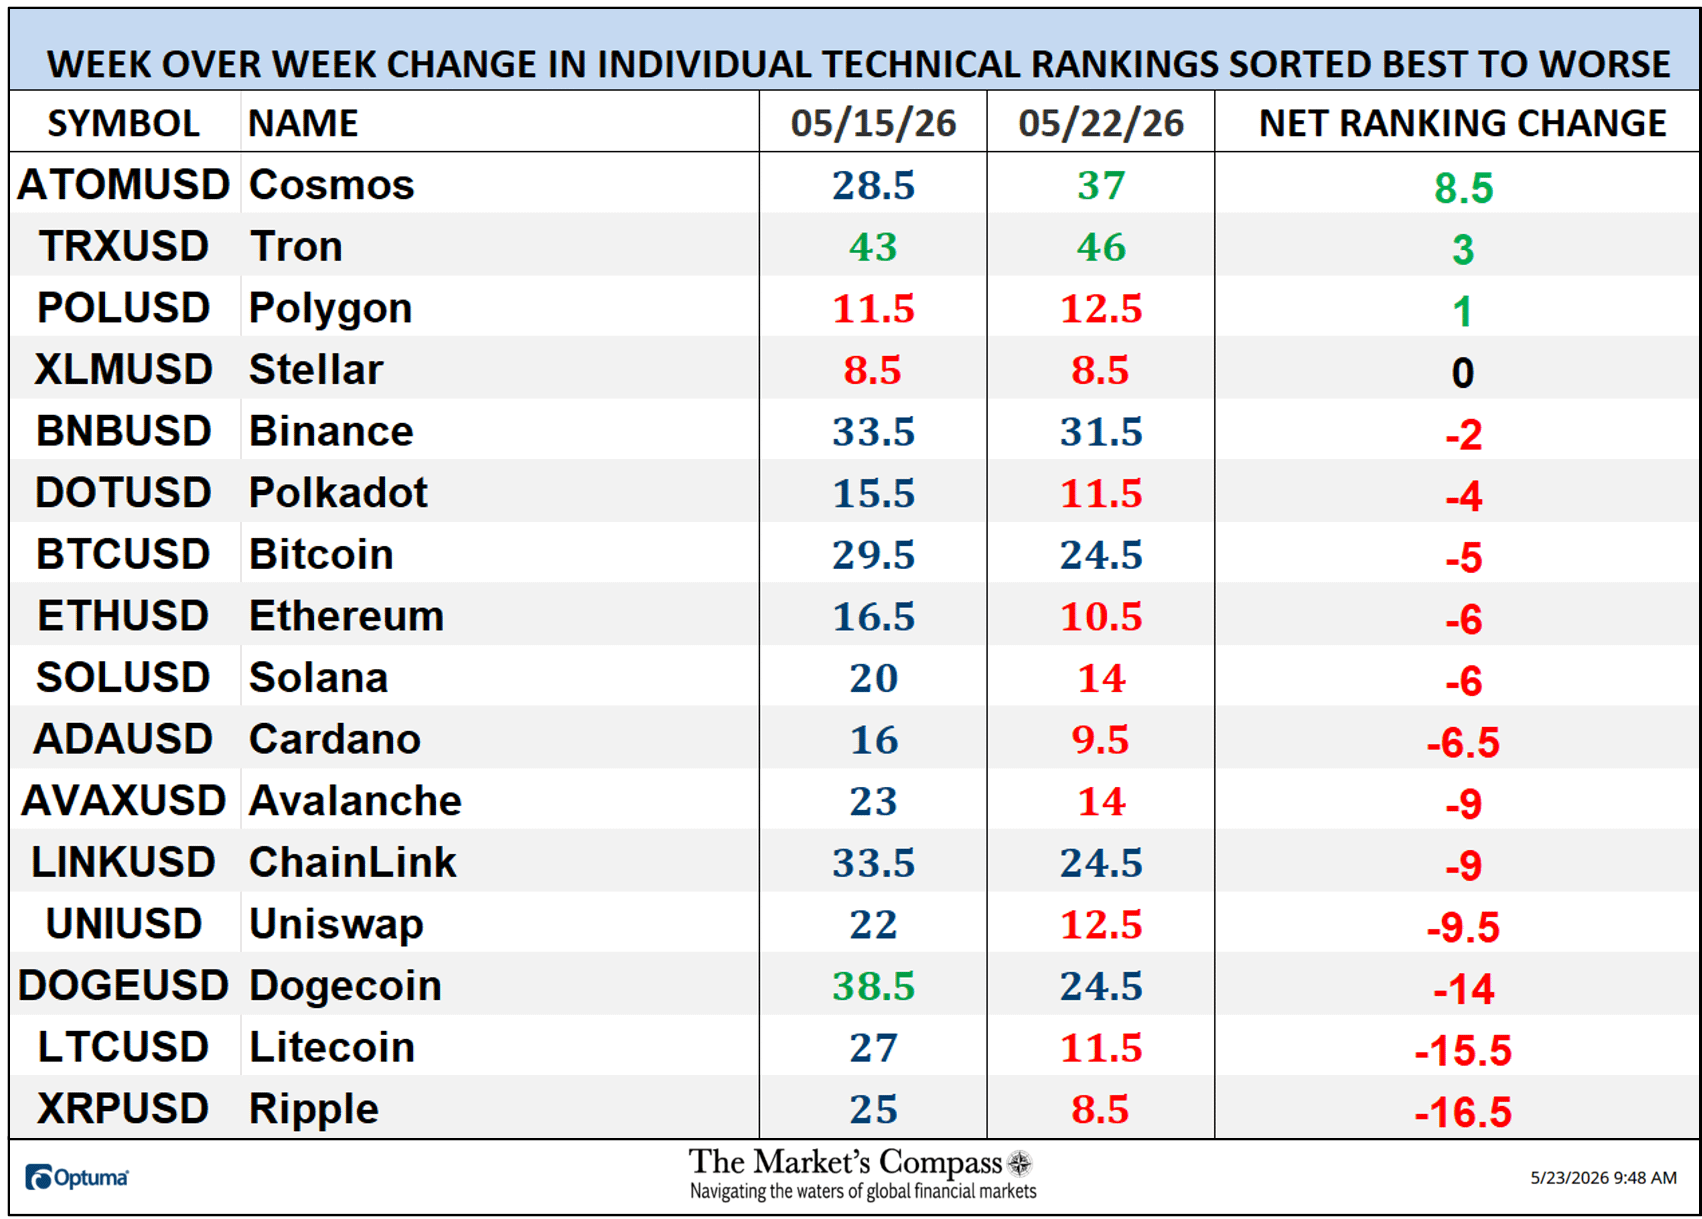
Last week three of the Sweet Sixteen TRs gained ground, one was unchanged, and twelve TRs fell. Two of the Crypto Currency TRs ended the week in the “green zone” (TRs between 35 and 50), four were in the “blue zone” (TRs between 15.5 and 34.5), and ten were in the “red zone” (TRs between 0 and 15). Eight of the ten fell into the “red zone” from the “blue zone”. Both Polygon (POL) and Stellar (XLM) remained in the “red zone” for the second week in a row. The previous week when there were two TRs in the “green zone” and twelve were in the “blue zone” and, as mentioned above, two were in “red zone”. The Average TR loss on the week was -5.66 adding to the previous week’s Average TR loss of -4.13.
*The 13-Week Exponential Moving Average (EMA) lines smooths what can be “choppy” Technical Rankings and better define trend. Changes in the EMA trends with follow-through are signals worthy of consideration.
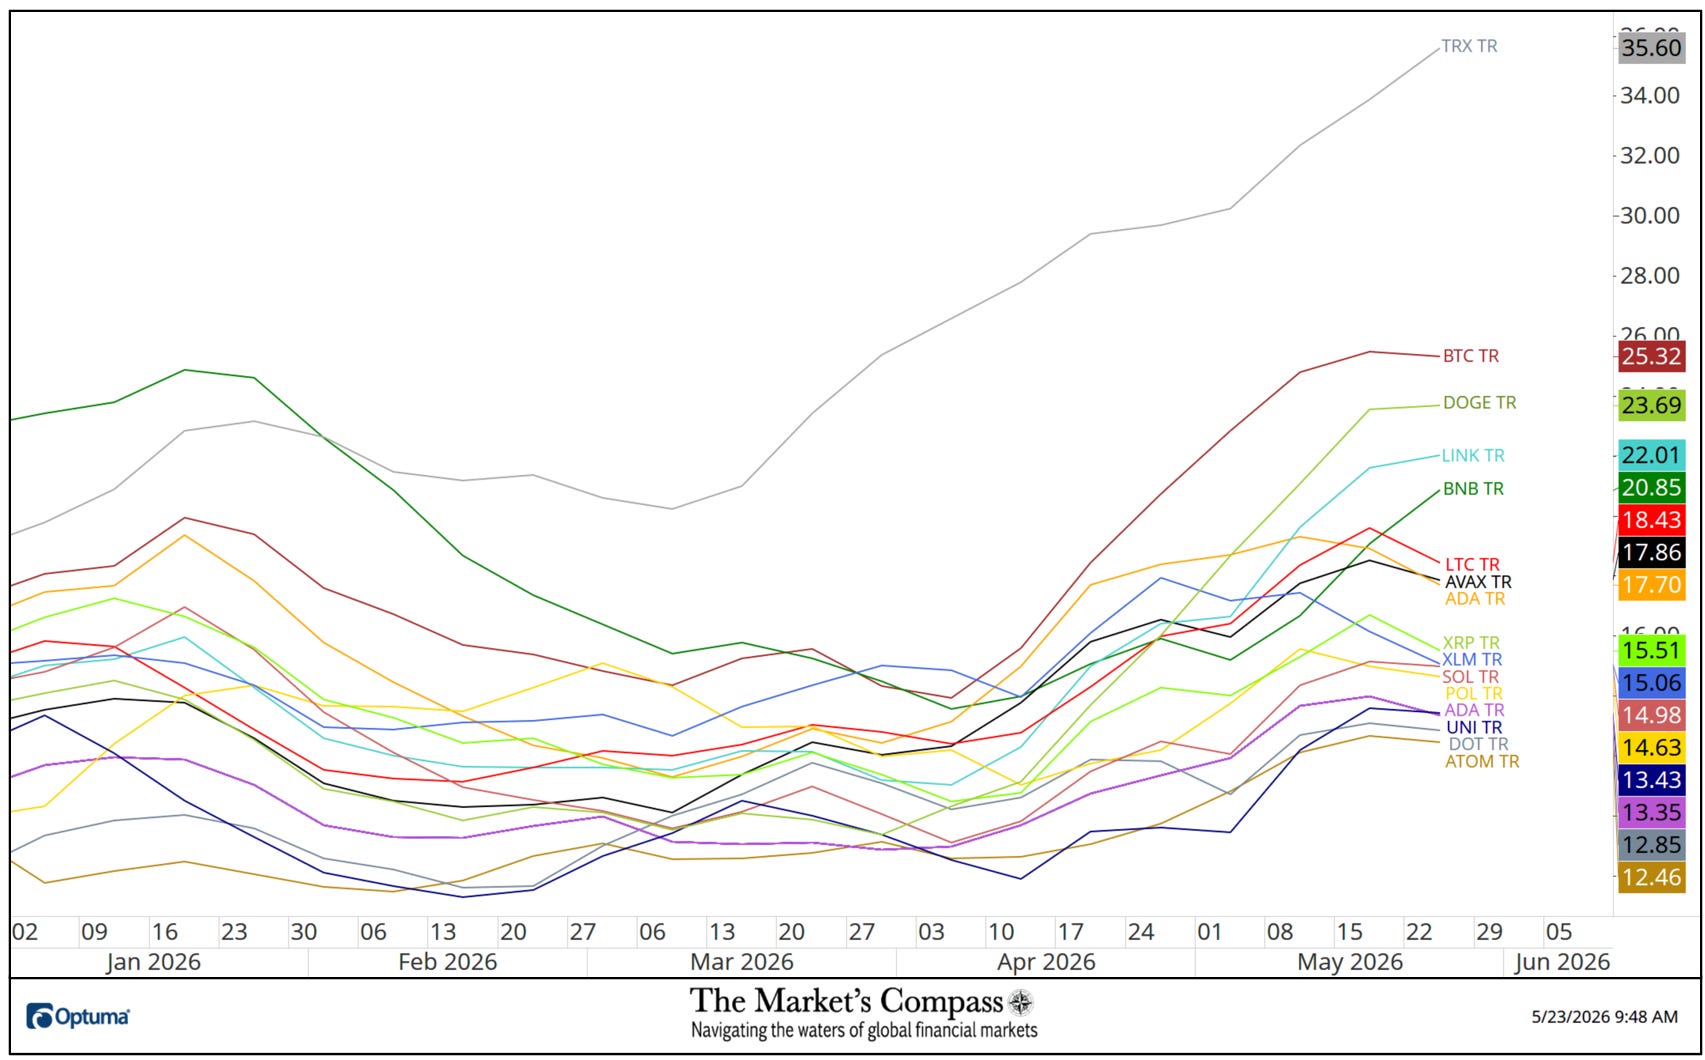
Since the start of the year, Tron’s (TRX) Technical Ranking EMA trend has consistently outpaced the Sweet Sixteen Crypto Currencies that we track in these pages by a “long shot”. Only Binance (BNB) registered a higher 13-Week EMA in January but contracted until it began to improve in early April. Bitcoin (BTC) has been a Technical Ranking EMA leader since the start of the year. Dogecoin’s (DOGE) 13-Week EMA has accelerated since late March. Stellar’s (XLM) Technical Ranking and in turn, its EMA is beginning to look problematic.
The Relative Rotation Graph, commonly referred to as RRGs, was developed in 2004-2005 by Julius de Kempenaer. These charts are a unique visualization tool for relative strength analysis. Chartists can use RRGs to analyze the relative strength trends of several securities against a common benchmark, (in this case the CCi30 Index*) and against each other over any given period (in the case below, daily) over the past two weeks. The power of RRG is its ability to plot relative performance on one graph and show true rotation. All RRGs charts use four quadrants to define the four phases of a relative trend. The Optuma RRG charts rotates from Leading (in green) to Weakening (in yellow) to Lagging (in pink) to Improving (in blue) and back to Leading (in green). True rotations can be seen as securities move from one quadrant to the other over time. This is only a brief explanation of how to interpret RRG charts. To learn more, see the postscripts and links at the end of this Blog.
*The CCi30 Index is a registered trademark and was created and is maintained by an independent team of mathematicians, quants and fund managers lead by Igor Rivin. It is a rules-based index designed to objectively measure the overall growth, daily and long-term movement of the blockchain sector. It does so by indexing the 30 largest cryptocurrencies by market capitalization, excluding stable coins (more details can be found at CCi30.com).
The chart below has two weeks, or 14 days, of relative data points vs. the benchmark, deliniated by the dots or nodes. Not all of the Sweet Sixteen are plotted in this RRG Chart. I have done this for clarity purposes. Those which I believe are of higher technical interest remain.
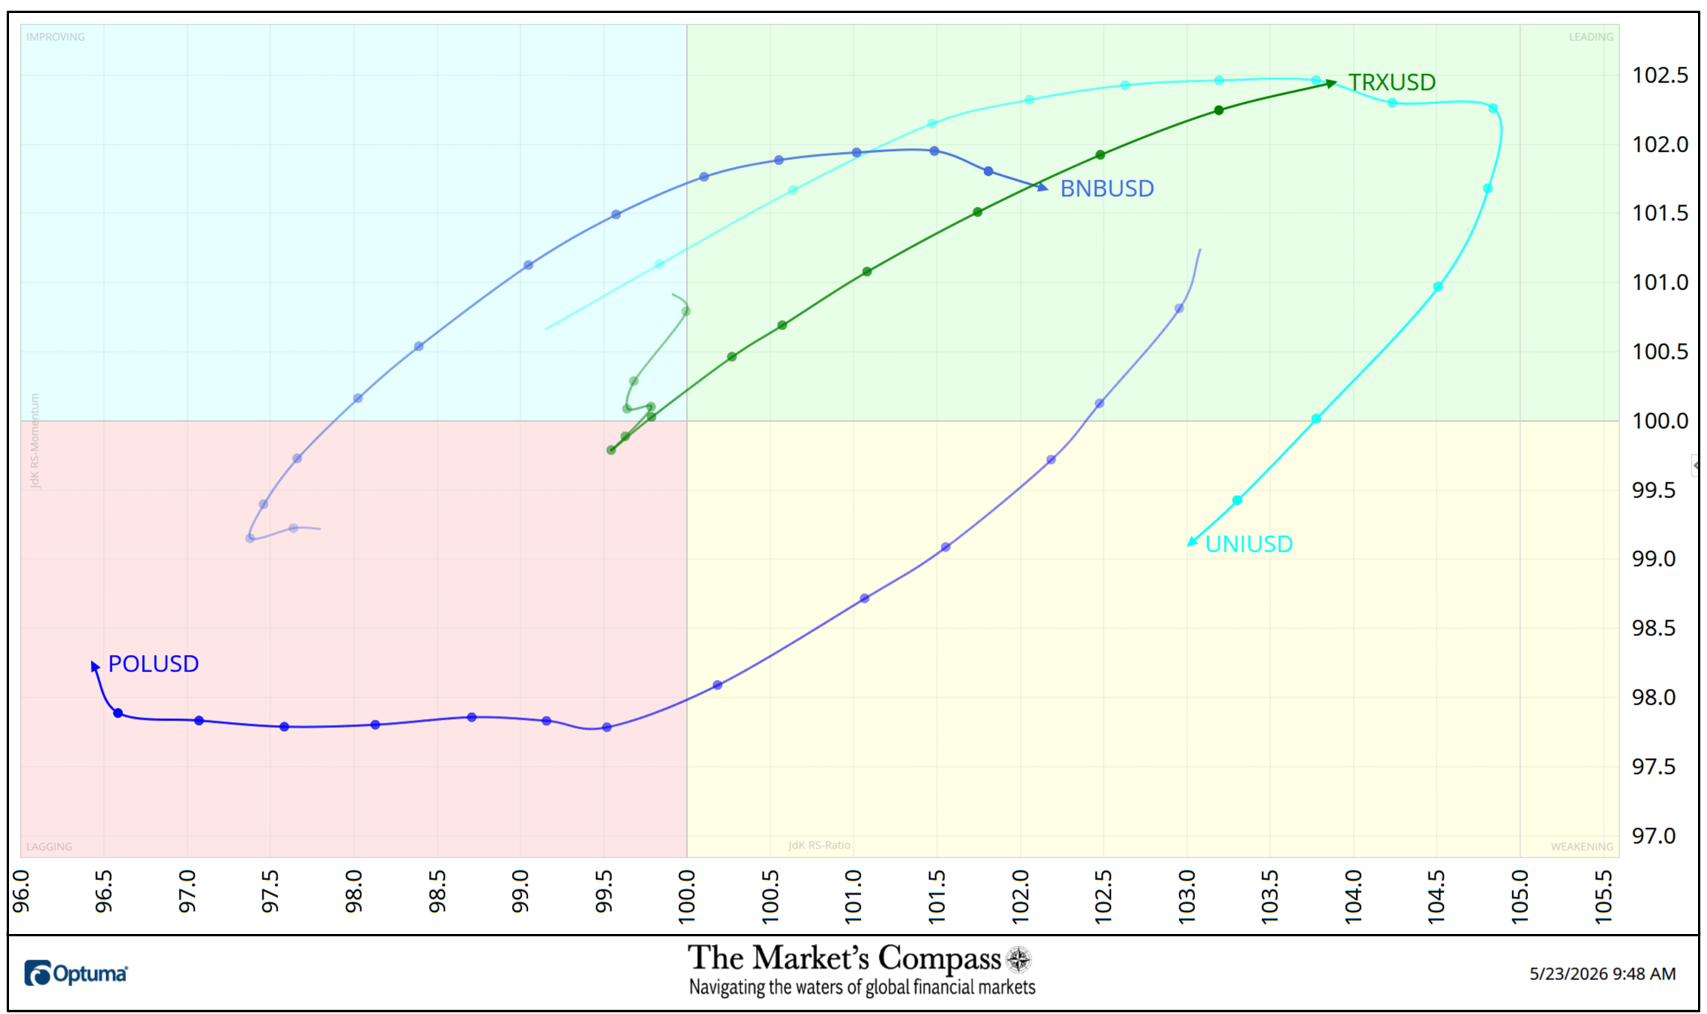
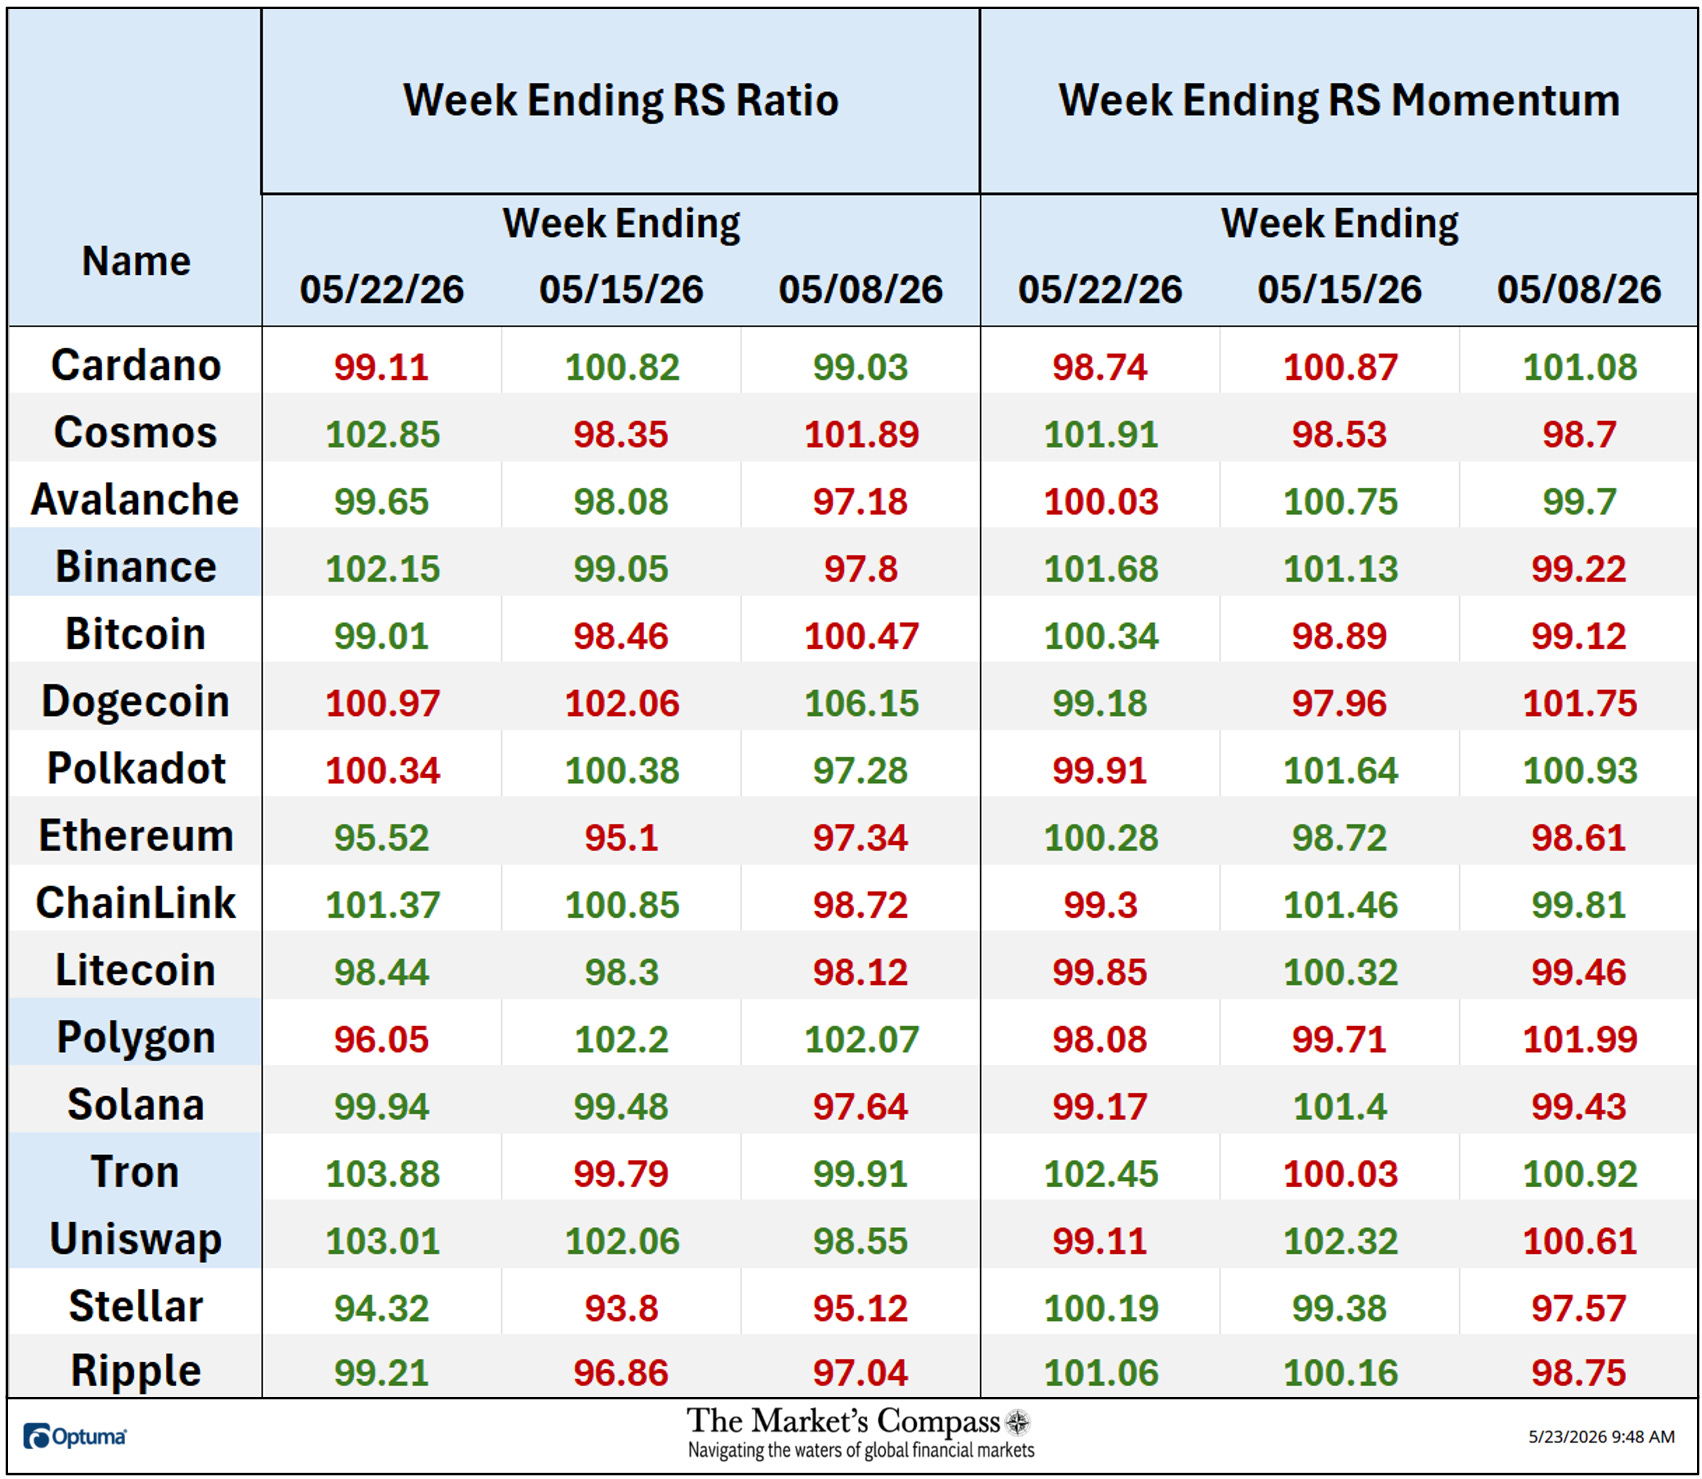
After a stutter step into the Lagging Quadrant Tron (TRX) rose sharply into the Leading Quadrant at the end of the week exhibiting noteworthy Relative Strength Momentum at 102.45 and the highest Relative Strength Ratio at 103.88 (see the Tabulation Table below). Binance (BNB)has made what I call, a “three quadrants move” by rising out of the Laging Quadrant through the Improving Quadrant, displaying strengthening Relative Strength Momentum (note the distance between the daily nodes). and into the Leading Quadrant despite a slight loss of momentum at weeks end. Uniswap (UNI) has done a U-turn and has fallen out of the Leading Quadrant and into the Weakening Quadrant. Polygon has made a negative “three quadrants move” over the past two weeks by initially falling out of the Leading Quadrant through the Weakening Quadrant and spending last week grinding sideways in the Lagging Quadrant before a slight upturn at the end of the week.
The “Tabulation Table” below marks the Relative Strength and Relative Strength Momentum readings of the Sweet Sixteen vs. the CCi30 Index at the end of last week and the end of the two preceding weeks. If there has been an improvement in either the Relative Strength Ratio or the Relative Strength Momentum reading since the end of the preceding week, I have highlighted it in green. If there has been a contraction in either it is highlighted in red and an unchanged reading in either will remain black*. The color-coding system has served as a heat map over the past three weeks highlighting either the continued improvement, deterioration, or stasis vs. the benchmark CCi30 Index. The crypto currencies that are in the comments below the RRG chart are highlighted in blue.
*Tip of the hat goes to my son-in-law, RJ Hausler, who has now programed the color changes in Excel for me.
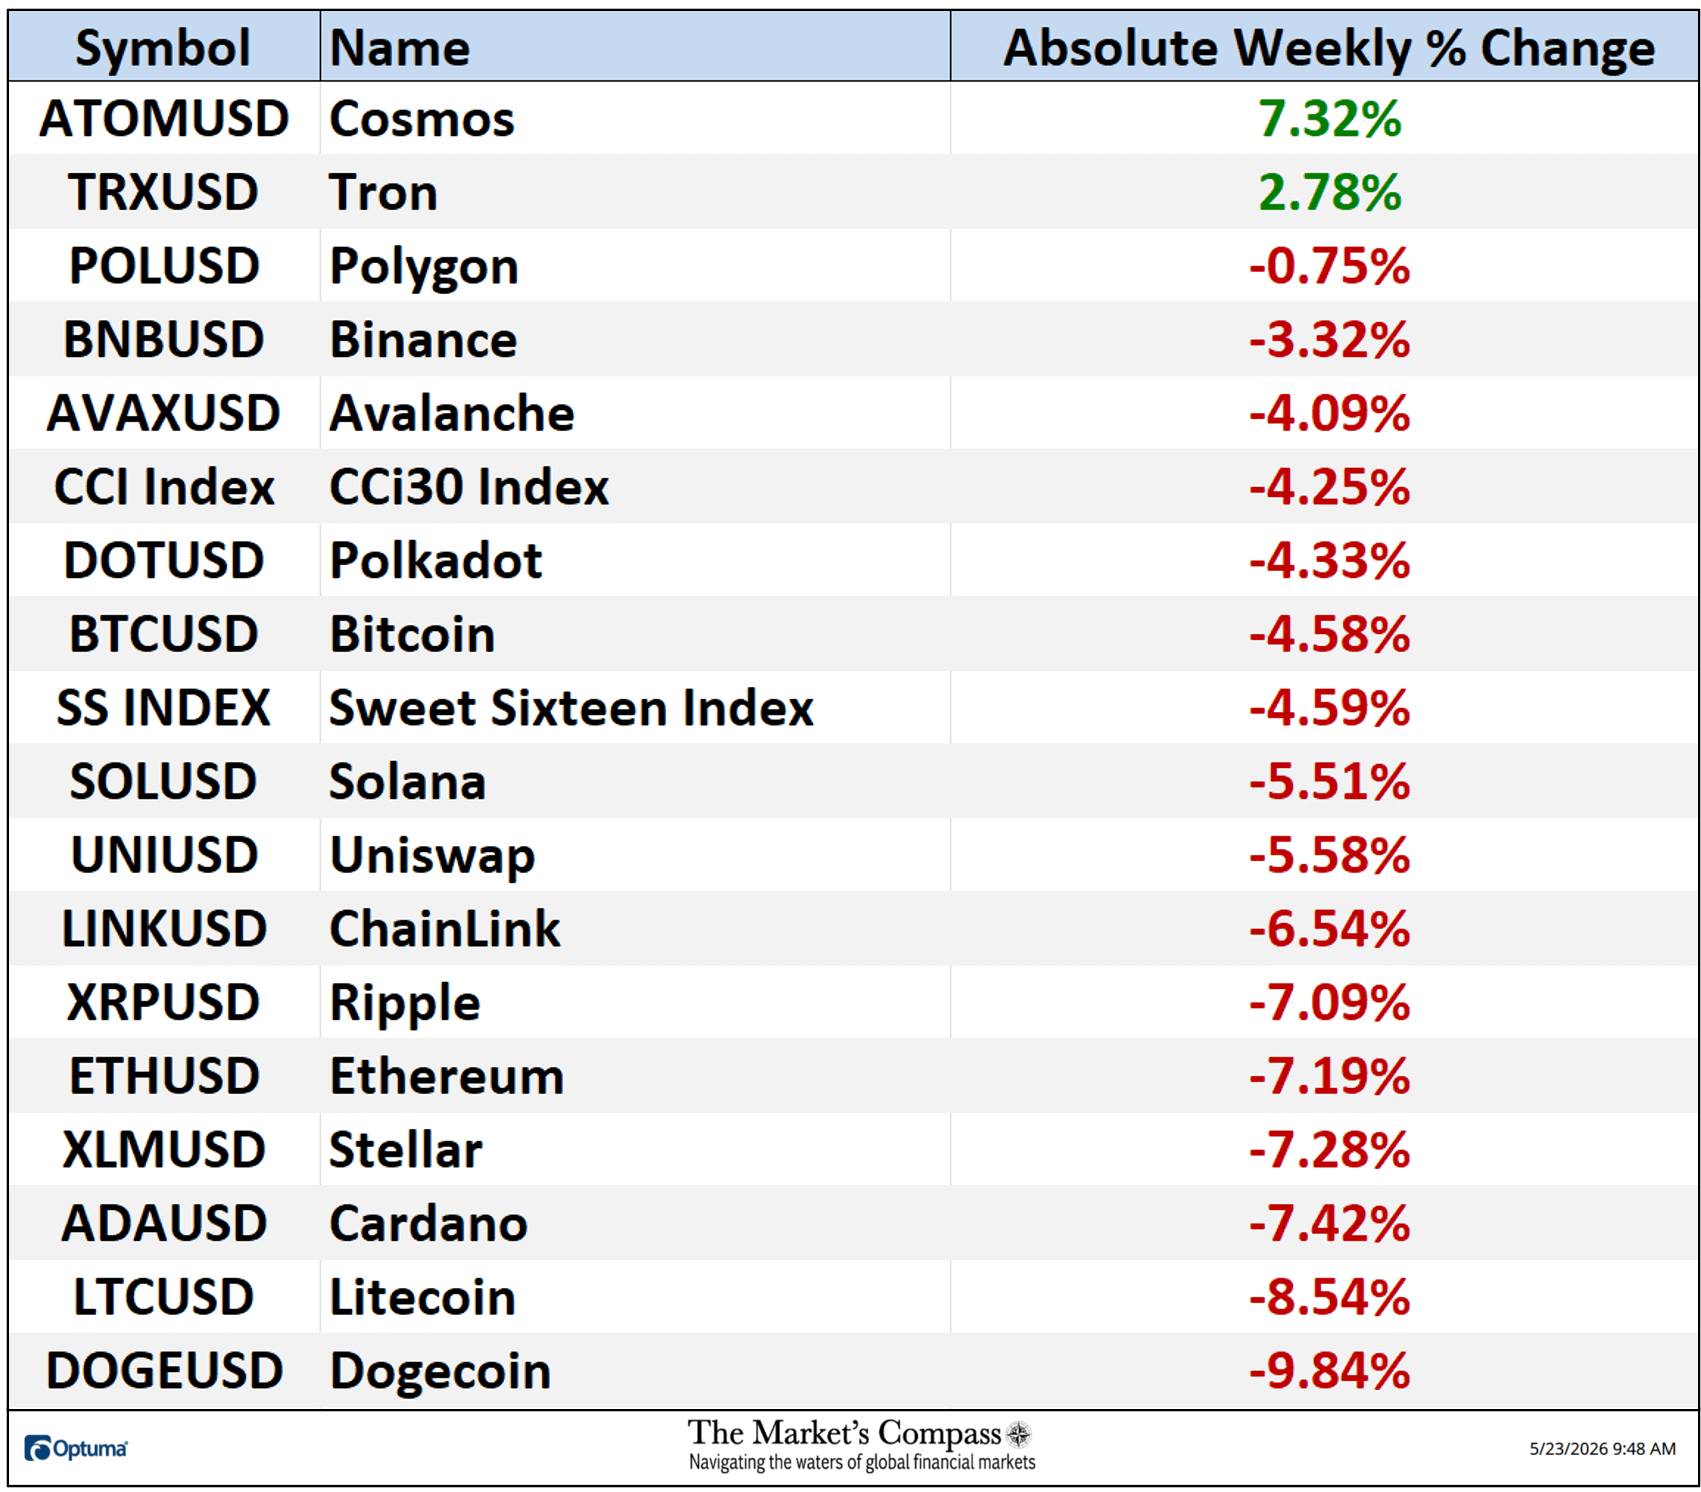
*Friday May 15th to Friday May 22nd
Over the past seven days only two of the Sweet Sixteen gained absolute ground and fourteen traded lower vs the previous week when four of the Sweet Sixteen gained absolute ground and twelve traded lower. Three weeks ago, the CCi30 Index, the Sweet Sixteen Index and all the individual Sweet Sixteen Crypto Currencies registered absolute price gains. Last week the average absolute percentage loss was -4.50%, adding to the average percentage loss the week before of -2.22%. Both weekly average gains and losses exclude the two Indexes.
The Technical Condition Factors or TCFs are utilized in the calculation of the Individual Crypto Currencies Technical Rankings. What is shown in the excel panel below is the total TCFs of all sixteen TRs. A few TCFs carry more weight than the others, such as the Weekly Trend Factor and the Weekly Momentum Factor in compiling each individual TR of each of the 16 Cryptocurrencies. Because of that, the excel sheet below calculates each factor’s weekly reading as a percentage of the possible total.
A full explanation of my Technical Condition Factors go to www.themarketscompass.com. Then go to the MC’s Technical Indicators and select Crypto Sweet 16.
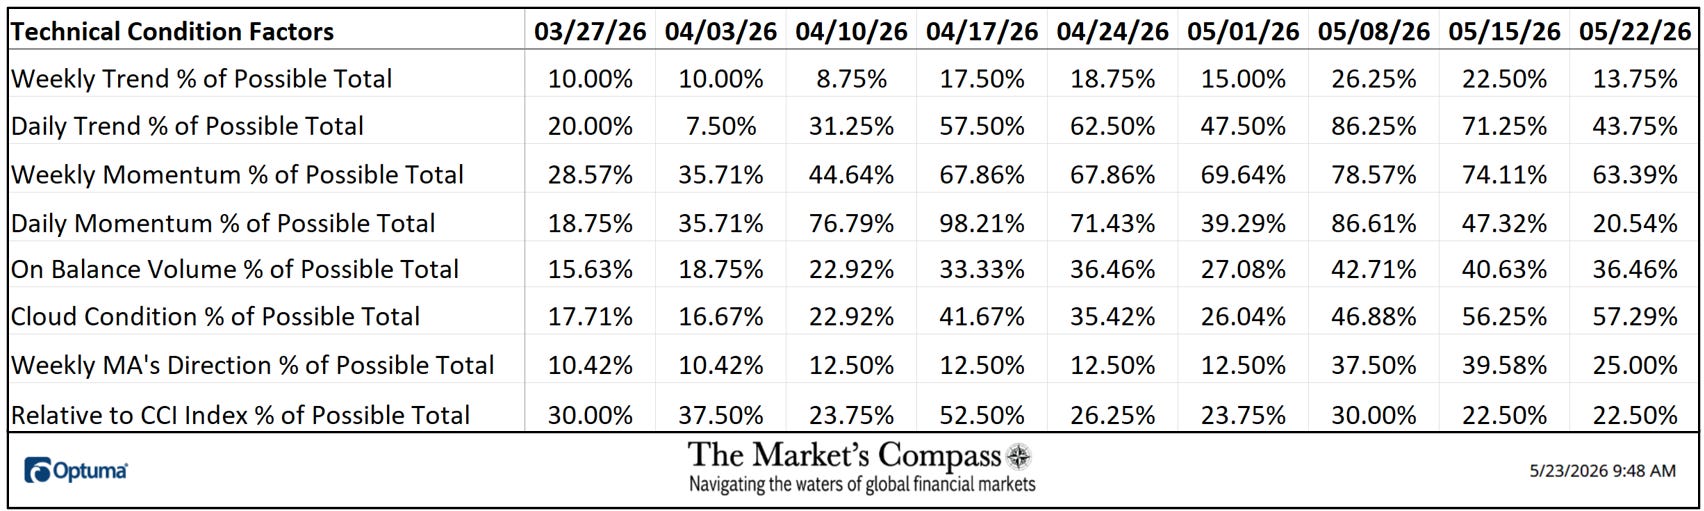
The Daily Momentum Technical Condition Factor or “DMTCF” fell back to 20.54% or 23 out of a possible 112 from an almost overbought reading of 86.61% reading or 97 three weeks ago.
As a confirmation tool, if all eight TCFs improve on a week over week basis, more of the 16 Cryptocurrencies are improving internally on a technical basis, confirming a broader market move higher (think of an advance/decline calculation). Conversely, if more of the TCFs fall on a week over week basis, more of the “Cryptos” are deteriorating on a technical basis confirming the broader market move lower. At the end of last week six of the TCFs marked decreases, one was unchanged and only one rose.
The “TSSTCF” Oscillator tallies the eight objective Technical Condition Factors into one overbought / oversold indicator that ranges between 0 and 8.
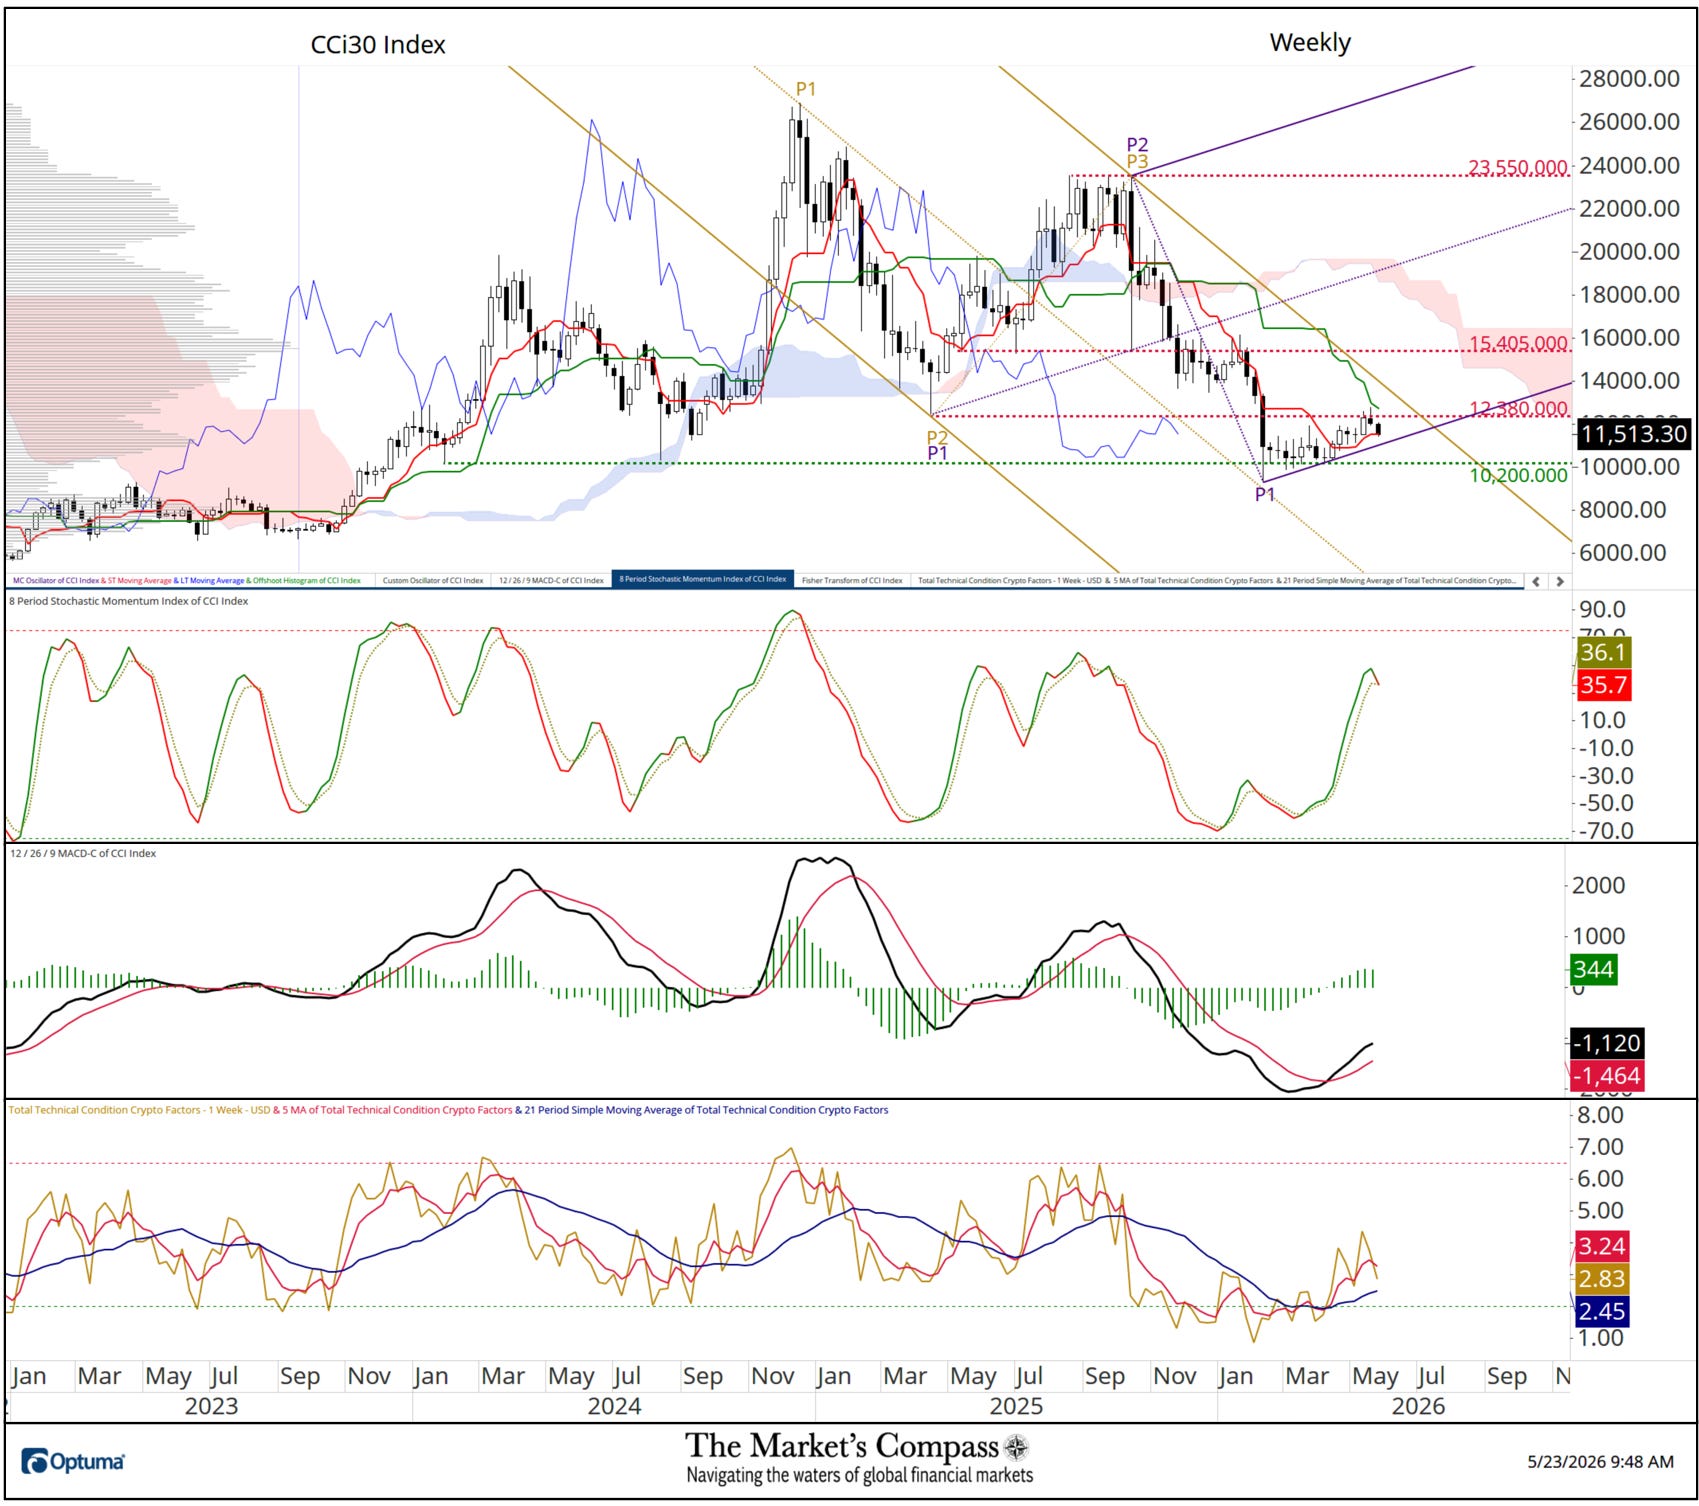
The sub-title to last week’s Crypto Sweet Sixteen Study was “More Hurdles Ahead”. Those price hurdles remain in place and have capped a continuation of the uptrend in the Weekly chart. Although the CCi30 Index stuck its head above price resistance at the 12,390 level the Kijun Plot (falling green line) forced prices back below price resistance and last week the index pulled back further but managed to hold above the rising Lower Parallel (solid violet line) of the shorter-term Standard Pitchfork (violet P1 through P3). The Stochastic Momentum Index has in turn hooked slightly lower but it would be premature to suggest that it an end to the recovery from the P1 price pivot low. Loger-term MACD on the other hand continues to climb above its signal line away from oversold territory. Although the Total Technical Condition Crypto Factor Oscillator has dropped below its shorter-term 5-Week Moving Average (red line) it did not print a lower low and remains above it rising longer-term 21-Week Moving Average (blue line).
Only a drop below the Lower Parallel and in turn a violation of price support at 10,200 would suggest that the 15-week rally was a counter trend rally and that the early February lows did not mark the nadir in the CCi30 Index.
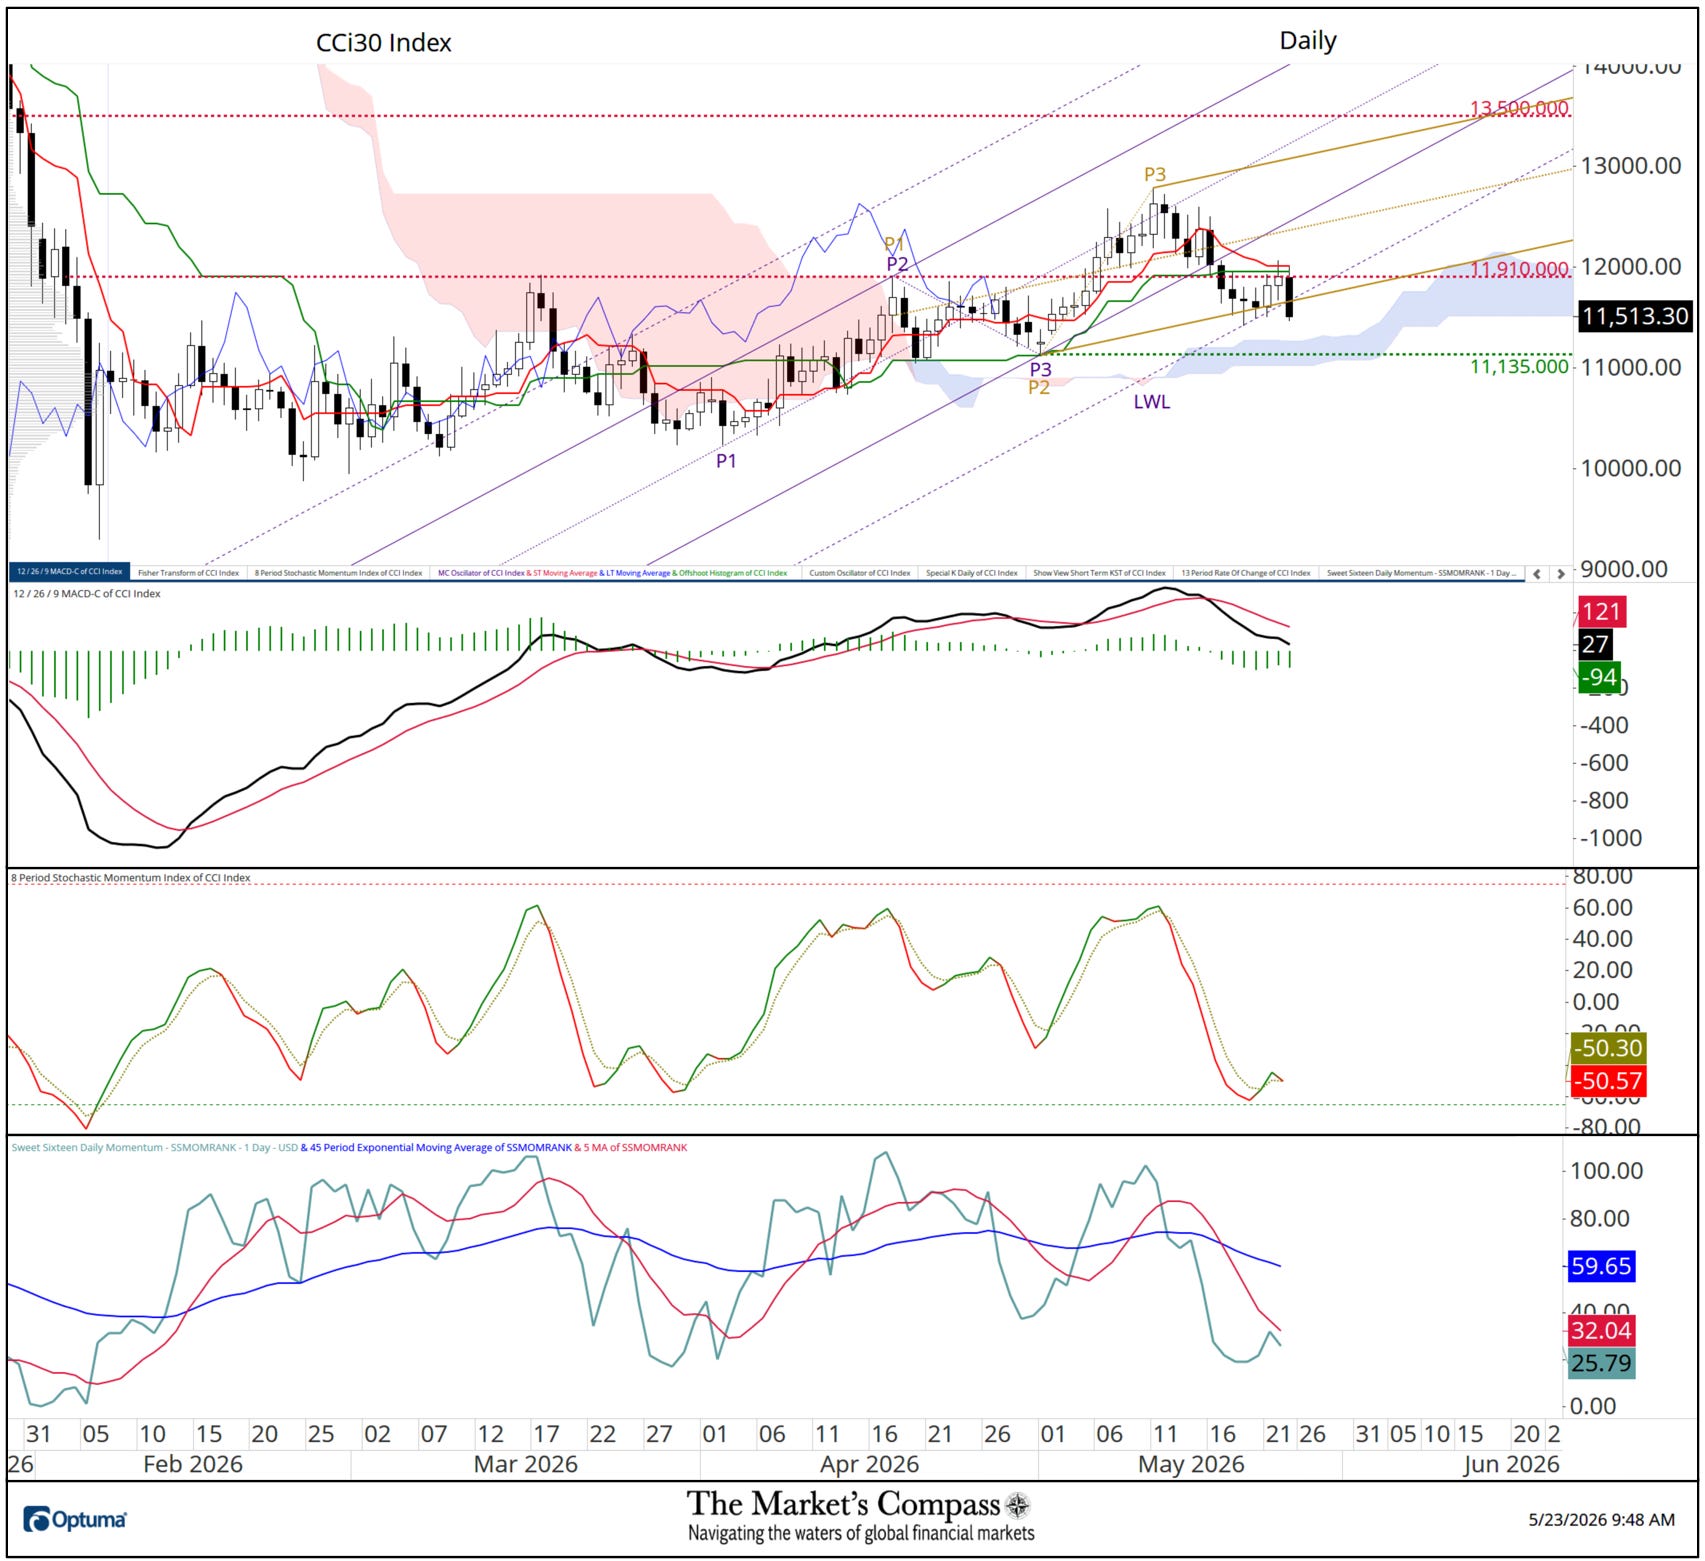
There are more than a few technical features on the Daily chart that are concerning. Foremost is the price action last Friday which failed again to close above both the Kijun (green line) and Tenkan (red line) Plots as well as price resistance at the 11,910 level and a price reversal unfolded that broke potential support at the Lower Warning Line (violet dashed line) of the longer-term Standard Pitchfork (violet P1 through P3) and the Lower Parallel (solid gold line) of the newly drawn Schiff Pitchfork (gold P1 through P3). Also, MACD is tracking lower below its signal line and is in danger of entering negative territory. The Stochastic Momentum Index’s rise from oversold territory has rolled over and the Sweet Sixteen Daily Momentum / Breadth Oscillator’s turn higher was derailed by its 5-Day Moving Average and has hooked lower.
Needless to say, these technical features have likely disheartened the bulls and that barring a sharp reversal Cloud and price support at the 11,135.00 will be tested.
For readers who are unfamiliar with the technical terms or tools referred to in the comments on the technical condition of the CCi30 Index can avail themselves of a brief tutorial titled, Tools of Technical Analysis and the three part Andrews Pitchfork Series available on my website.
Charts are courtesy of Optuma whose charting software allows the Technical Rankings to be calculated and back tested.


Be the first to comment