



TLDR
- XRP whales withdrew 122 million XRP (worth ~$170.8M) from Binance on May 22, the largest daily outflow since February.
- The $1.35–$1.40 range is being watched as a key accumulation zone, with large players repeatedly withdrawing near that price level.
- US spot XRP ETFs recorded positive inflows for 16 consecutive days, totaling $116.75 million.
- Analyst ChartNerd warns that losing $1.30 support could send XRP down to the “lower $1 territory.”
- Bollinger Bands are at their tightest since mid-2024, with historical precedent pointing to a 58%–82% price move ahead.
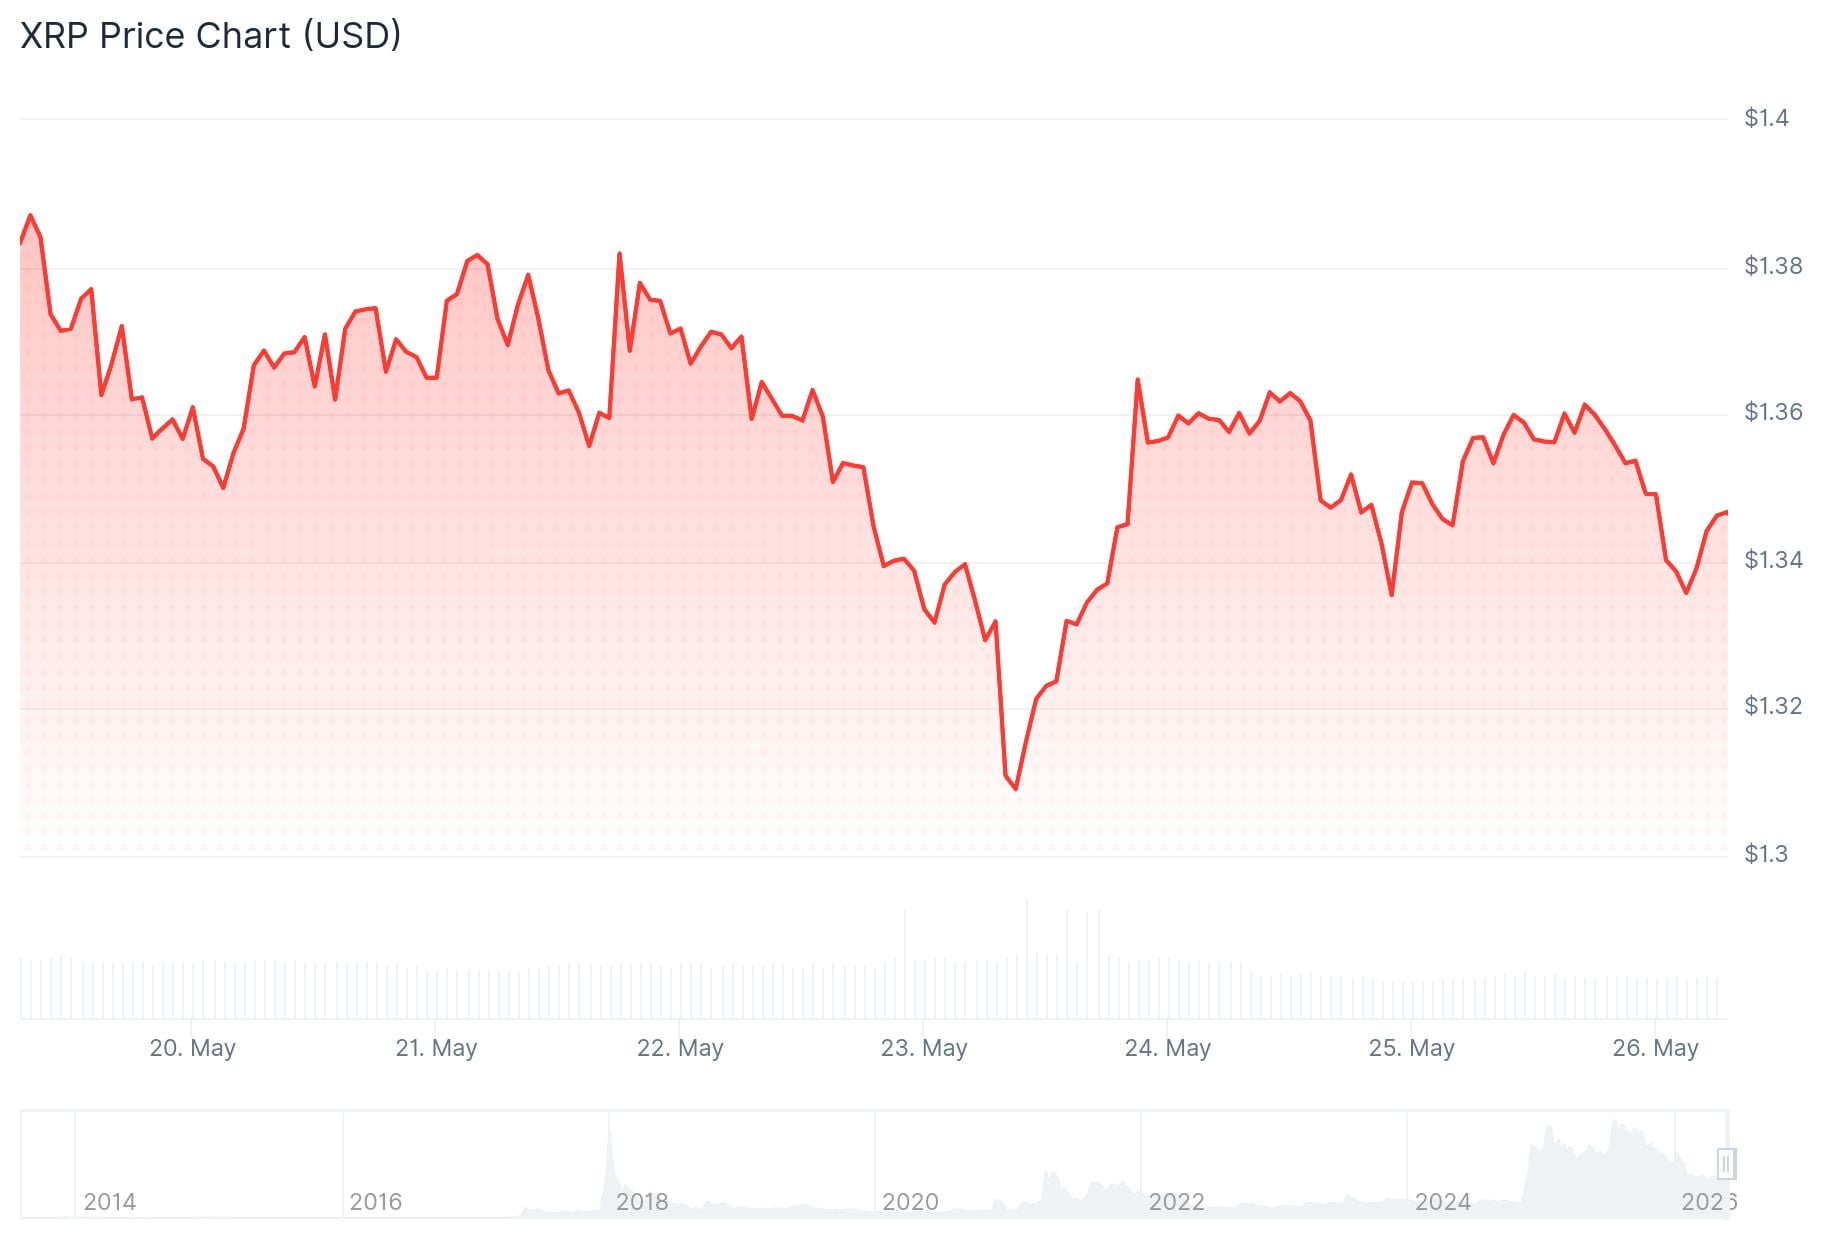
XRP is trading near $1.35 as whale activity and ETF inflows draw attention from analysts and traders.
On May 22, on-chain data from CryptoQuant showed that 122 million XRP — worth roughly $170.8 million — was withdrawn from Binance in a single day. That was the largest daily withdrawal above 100 million XRP since a 278 million XRP outflow in early February.
CryptoQuant analyst Amr Taha pointed out that the February spike happened when XRP was trading near $1.43, while the latest one occurred closer to $1.35. He noted that repeated withdrawals near the same price level may suggest that larger players see that range as a “value zone.”
On the same day, XRP’s net exchange position change fell to -$30 million — its most negative reading since April 9, when the price was around $1.28. That April dip was followed by a 17% price increase to $1.51 by April 17.
Spot ETF Demand Adds to the Picture
US spot XRP ETFs have now recorded positive inflows for 16 straight days, with a combined total of $116.75 million during that period. That sustained demand from US investors has been seen as an additional tailwind for the asset.
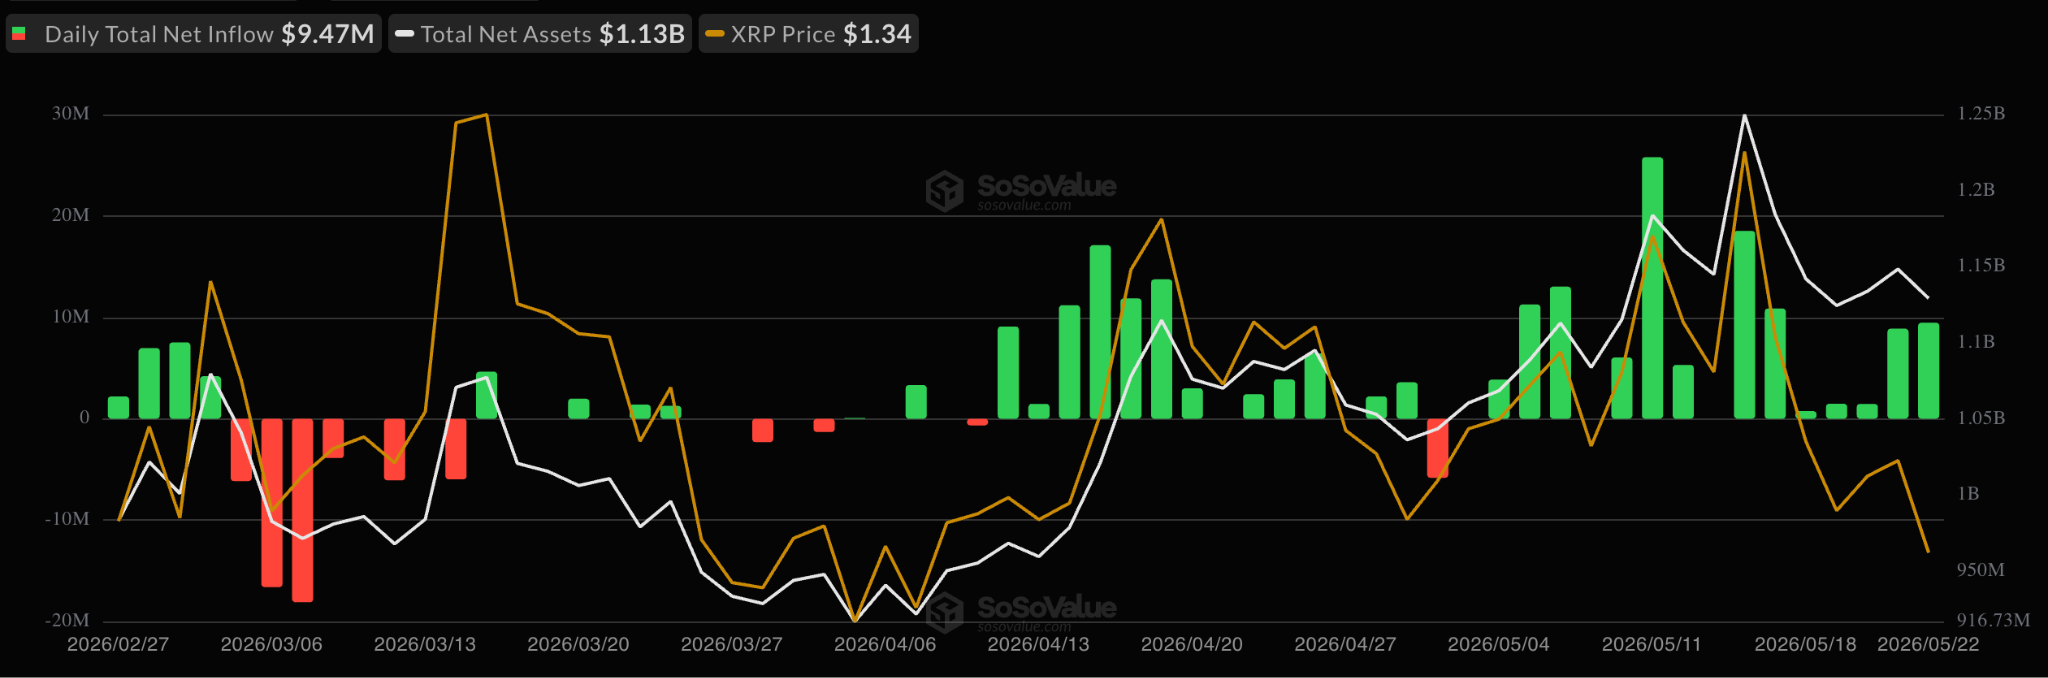
Exchange outflows combined with consistent ETF inflows point to tightening liquidity on the sell side.
Meanwhile, Santiment data shows XRP’s crowd sentiment has turned negative again, with a ratio of just 1.1 bullish comments for every 1 bearish comment. Santiment noted that historically, this kind of fear and skepticism has often acted as a contrarian signal, with previous dips into what it calls the “FUD zone” followed by price stabilization or bounces.

📉 XRP’s crowd sentiment has swung sharply negative again, with the ratio of positive to negative commentary dropping to just 1.1 bullish comments for every 1 bearish comment. Historically, this kind of fear and skepticism has often acted as a contrarian signal for XRP’s price.… pic.twitter.com/KGubO783yE
— Santiment Intelligence (@SantimentData) May 25, 2026
XRP has been trading in a range between $1.30 and $1.50 since early February. Analyst ChartNerd described $1.30 as a “current guardrail,” warning that a close below that level could lead to a drop into the lower $1 range.
Technical Indicators Signal a Potential Move
On the technical side, XRP’s Bollinger Bands are at their tightest since mid-2024. Previous instances of this compression have led to price movesali of between 58% and 82%, which would put a potential upside target near $2.33.
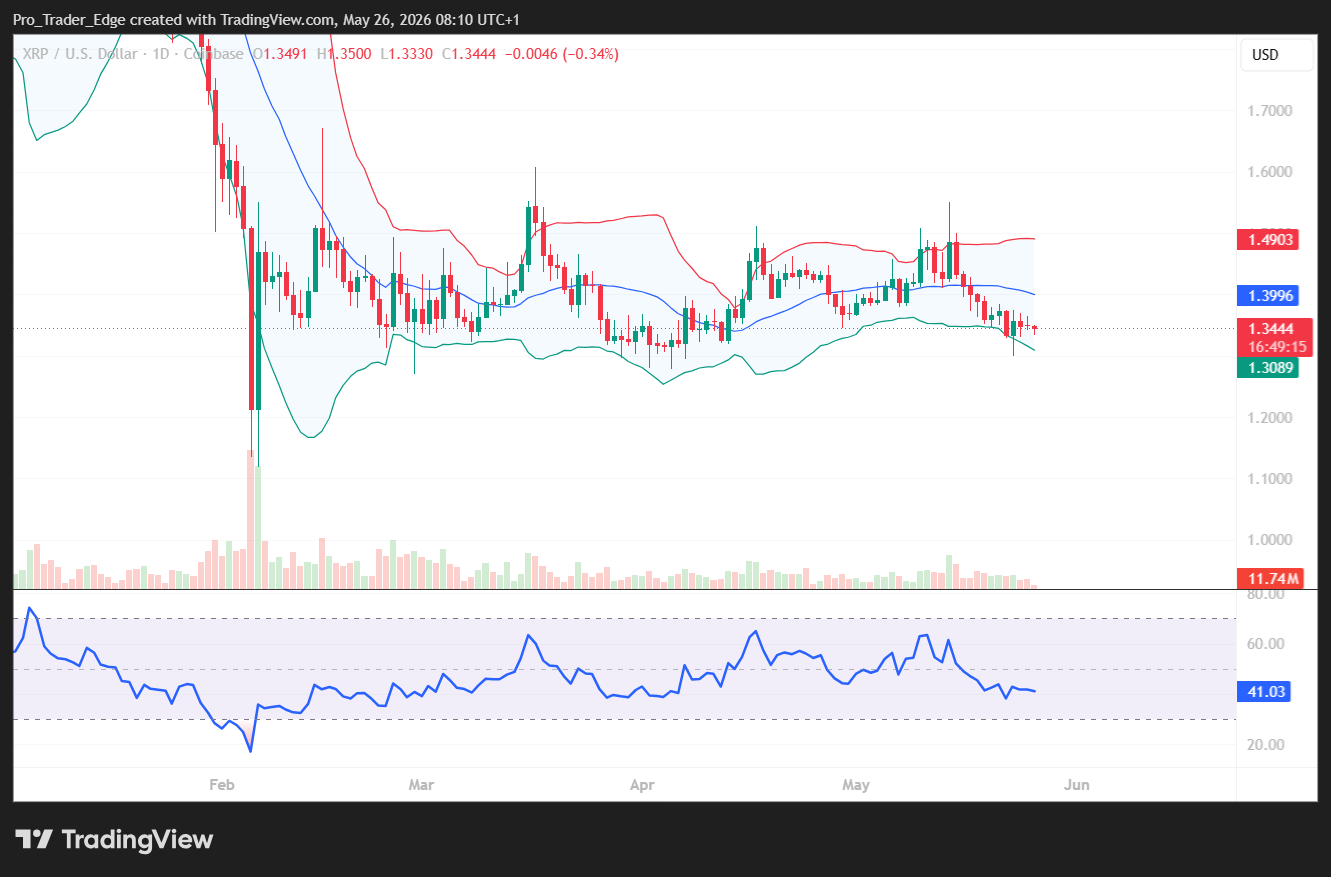
Analyst Crypto Patel compared the current range to the calm before XRP’s late-2024 breakout and set a longer-term target of $10.
As of May 26, XRP is trading below $1.3580 and below its 100-hourly simple moving average. Short-term resistance sits at $1.360, with the next levels at $1.3720 and $1.380. On the downside, support levels are at $1.330, $1.3280, and $1.30.


Be the first to comment