




TLDR
- Dogecoin is trading around $0.1014–$0.1026, holding above key $0.10 support.
- A falling wedge pattern on the chart is raising hopes of a bullish breakout.
- DOGE spot ETFs recorded $860,960 in inflows last week, showing steady institutional interest.
- Key resistance sits at $0.1050; a break above could target $0.1100 and then $0.1150.
- Analysts point to a potential local bottom forming on the weekly chart, with $0.0883 as the downside risk if support fails.
Dogecoin held above the $0.10 level on Tuesday as the wider crypto market softened. The token traded at $0.10259, down 0.74% in 24 hours, though daily volume jumped 31% to $719.25 million, showing continued trader interest.
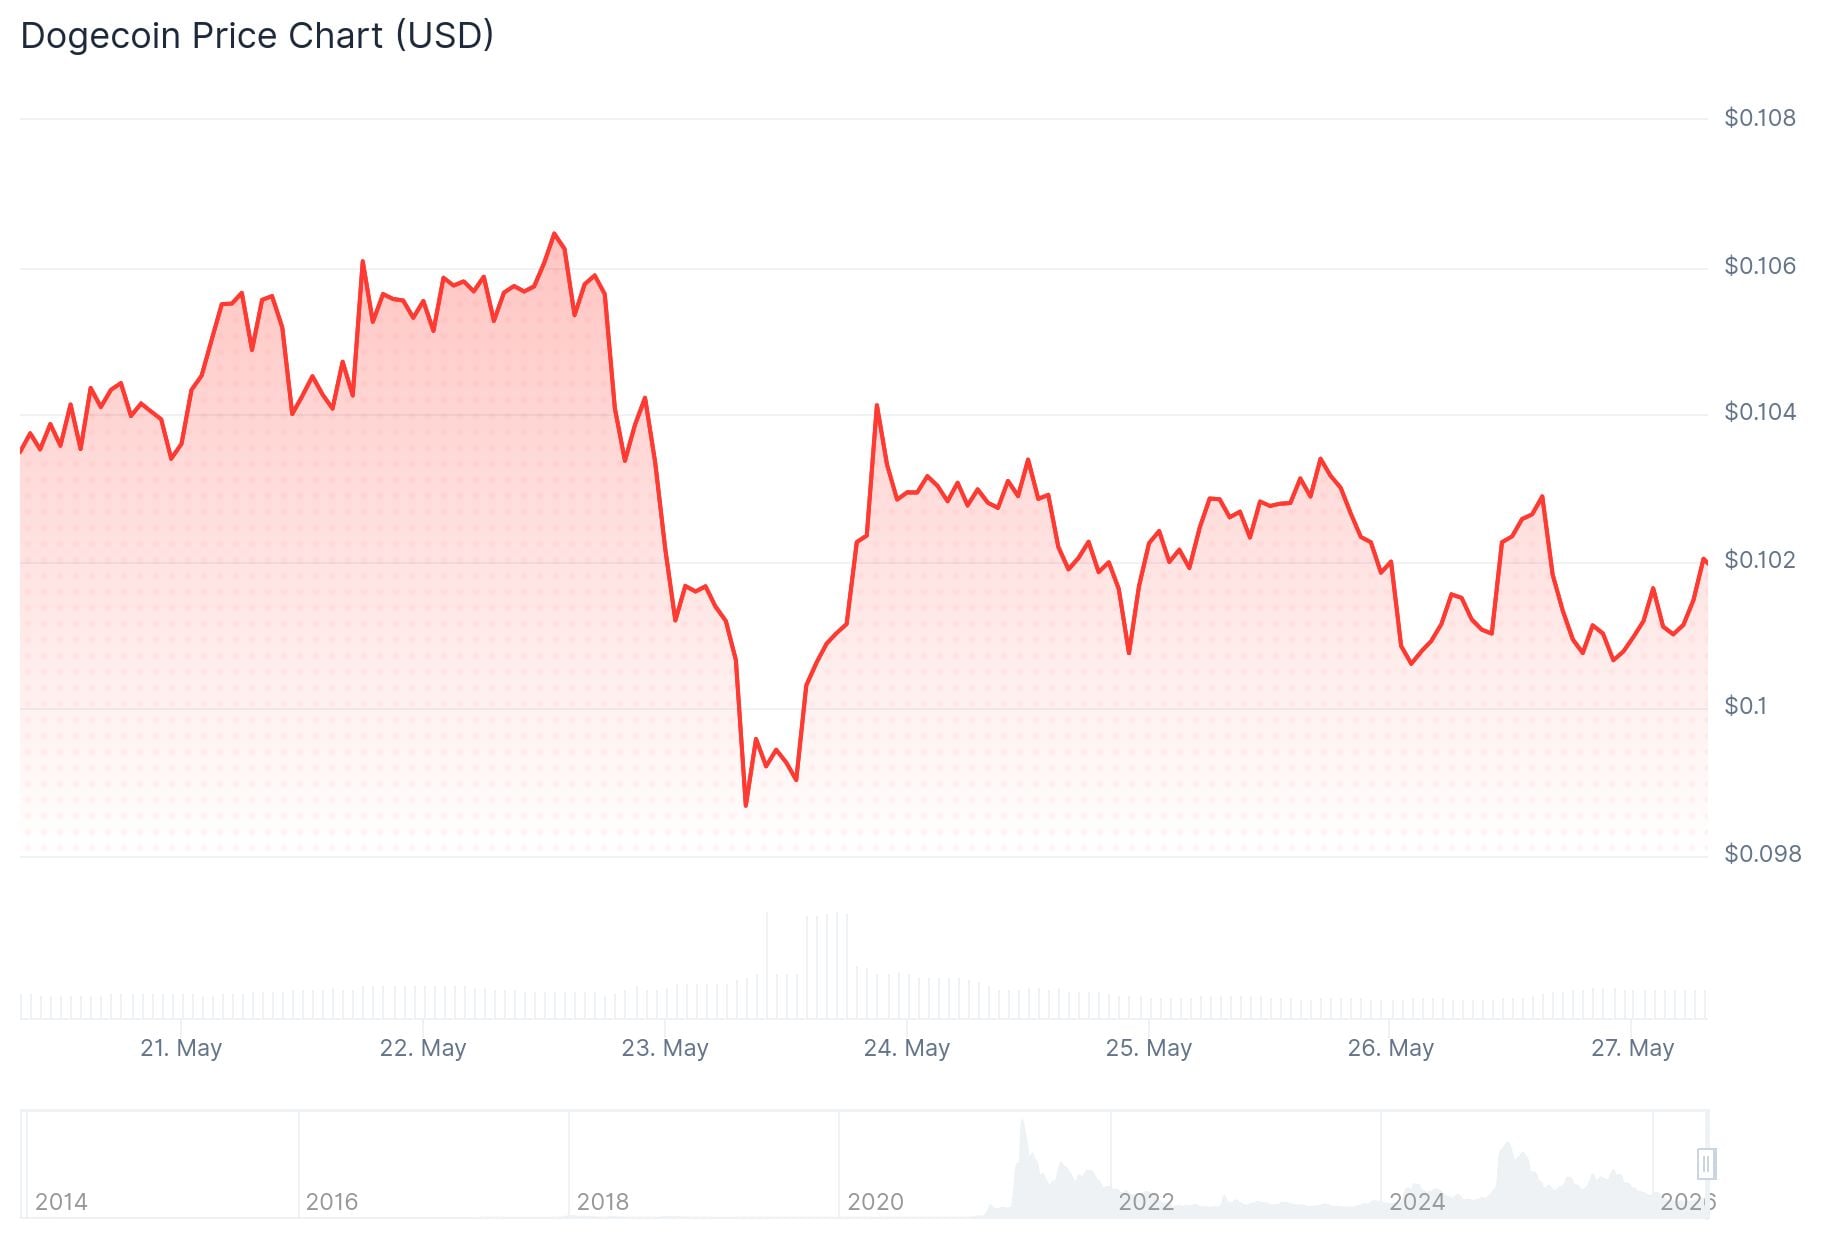
The broader crypto market fell 1.33% over the same period, pulling the total market cap to $2.56 trillion. Bitcoin dropped 1.01% to $76,866, adding pressure on altcoins including DOGE.
The selloff was tied to fresh U.S. defensive strikes on Iran, which pushed investors into a risk-off stance. Meme coins were hit harder than most in this environment.
Despite the dip, Dogecoin continued to attract institutional money. Data from Sosovalue showed DOGE spot ETFs recorded four straight weeks of positive inflows. Last week alone saw $860,960 flow into these products, pointing to ongoing demand from larger investors.
Falling Wedge Pattern Draws Attention
Crypto analyst Trader Tardigrade noted that DOGE has been trading inside a falling wedge pattern for several weeks. In this setup, price action tightens as buyers and sellers converge, often leading to a breakout.
$Doge/daily
❇️ #Dogecoin breakout from the Falling Wedge is around the corner.$DOGE has been compressing inside this wedge for weeks —
We’re sitting right at the apex now. Price is coiled and ready.Falling Wedge is one of the most reliable bullish reversal patterns. The… pic.twitter.com/eqNtMKhKfk
— Trader Tardigrade 🧬 (@TATrader_Alan) May 26, 2026
The pattern typically resolves to the upside. Traders are watching closely for a confirmed break above wedge resistance, which would be an early signal that momentum is shifting in DOGE’s favor.

On the 4-hour chart, price sits at $0.1014 with immediate resistance at $0.1050. A move above that level would open the path toward $0.1100, and stronger buying could push it to $0.1150, a level that acted as resistance earlier this month.
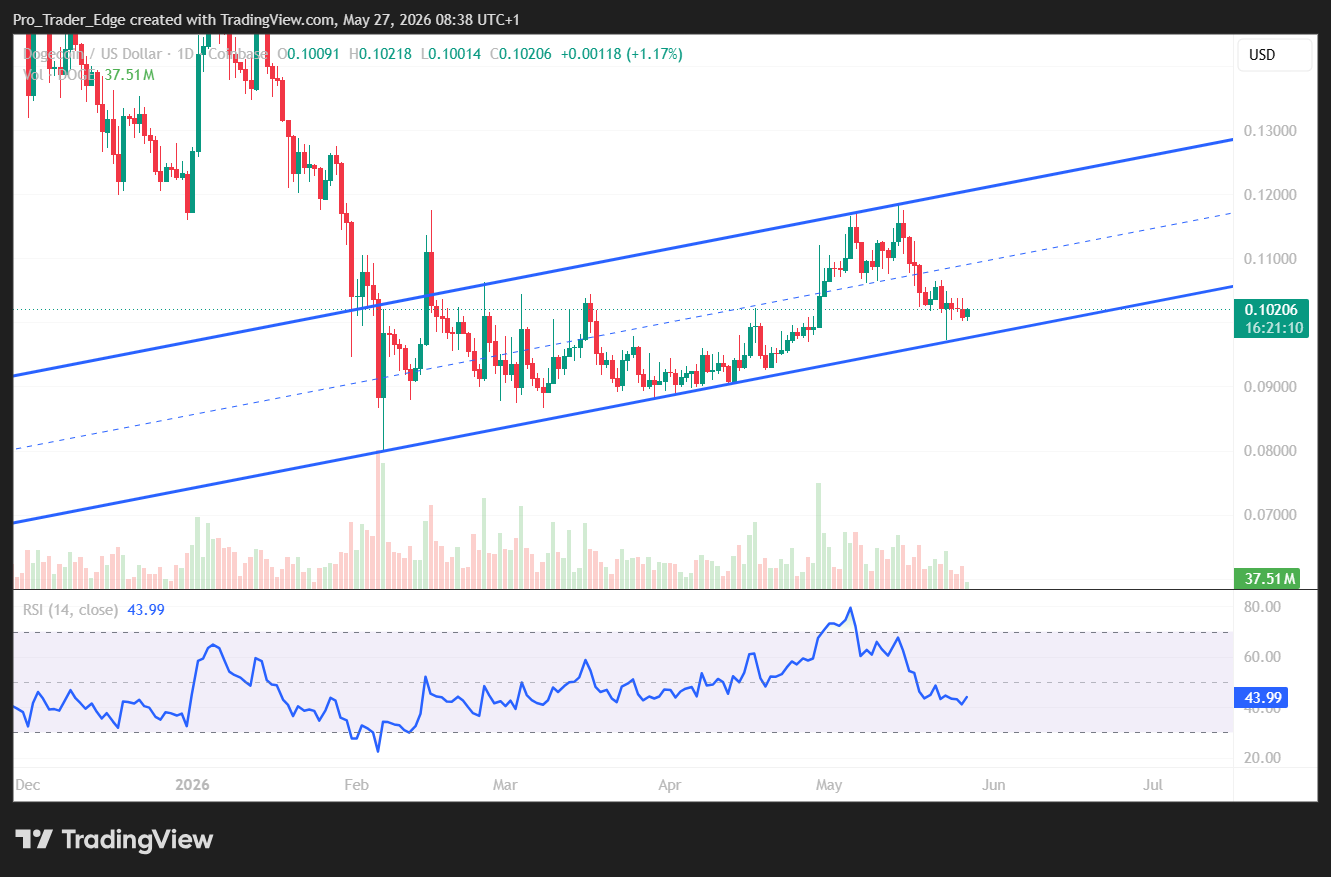
The RSI is reading around 44.50, which is weak but not oversold. The MACD is slightly negative, though the histogram is showing early signs of a possible recovery.
Key Support Levels to Watch
On the daily chart, analyst Ali Charts highlighted the $0.1020–$0.1027 zone as a key support area. This aligns with the channel midline and the 50-day simple moving average, giving it added technical weight.
This is a major support level for Dogecoin $DOGE.
Following a touch of the upper channel boundary, DOGE has retraced to $0.1020. This specific area is significant because it represents the mid-level of its multi-week channel and the exact location of the 50-day SMA.
This… https://t.co/u6UNRDhQeX pic.twitter.com/4JaAWroigs
— Ali Charts (@alicharts) May 25, 2026
DOGE recently pulled back from the top of its multi-week channel near $0.1156. That level is now the main upside target if buyers can hold the current zone.
If support breaks, Ali Charts pointed to the lower channel boundary near $0.0883 as the next downside target.
On the weekly chart, analyst Moe noted a pattern forming that resembles a 2024 bottom structure. DOGE has moved above a descending trendline, and the latest chart shows a rounded base taking shape in 2026.
Moe flagged the current zone as a potential local bottom. DOGE is pressing into three-month resistance, and a breakout above that band would be needed to confirm a stronger move higher. A rejection from that zone would keep DOGE inside its wider range.
DOGE spot ETFs last recorded $860,960 in weekly inflows over four consecutive positive weeks.



Be the first to comment