



Bitcoin’s price performance is certainly far from being bullish. At first, the rebound from the February lows appeared promising, but the rally came to a standstill just below the falling 200-day moving average, which was located between 81 and 82k. The short-term rising trendline that supported the move through April and early May has already been lost for Bitcoin, and that level clearly rejected the price.
For bulls, the moving averages are still in a poor position. The 20-day is below the 50-day, both are below the 200-day, and the price is currently trading below the shorter-term averages once more. This configuration typically represents a market in which rallies are consistently sold rather than accumulated. Moreover, momentum waned. Rather than increasing continuation strength, RSI rolled over below the 50 area.
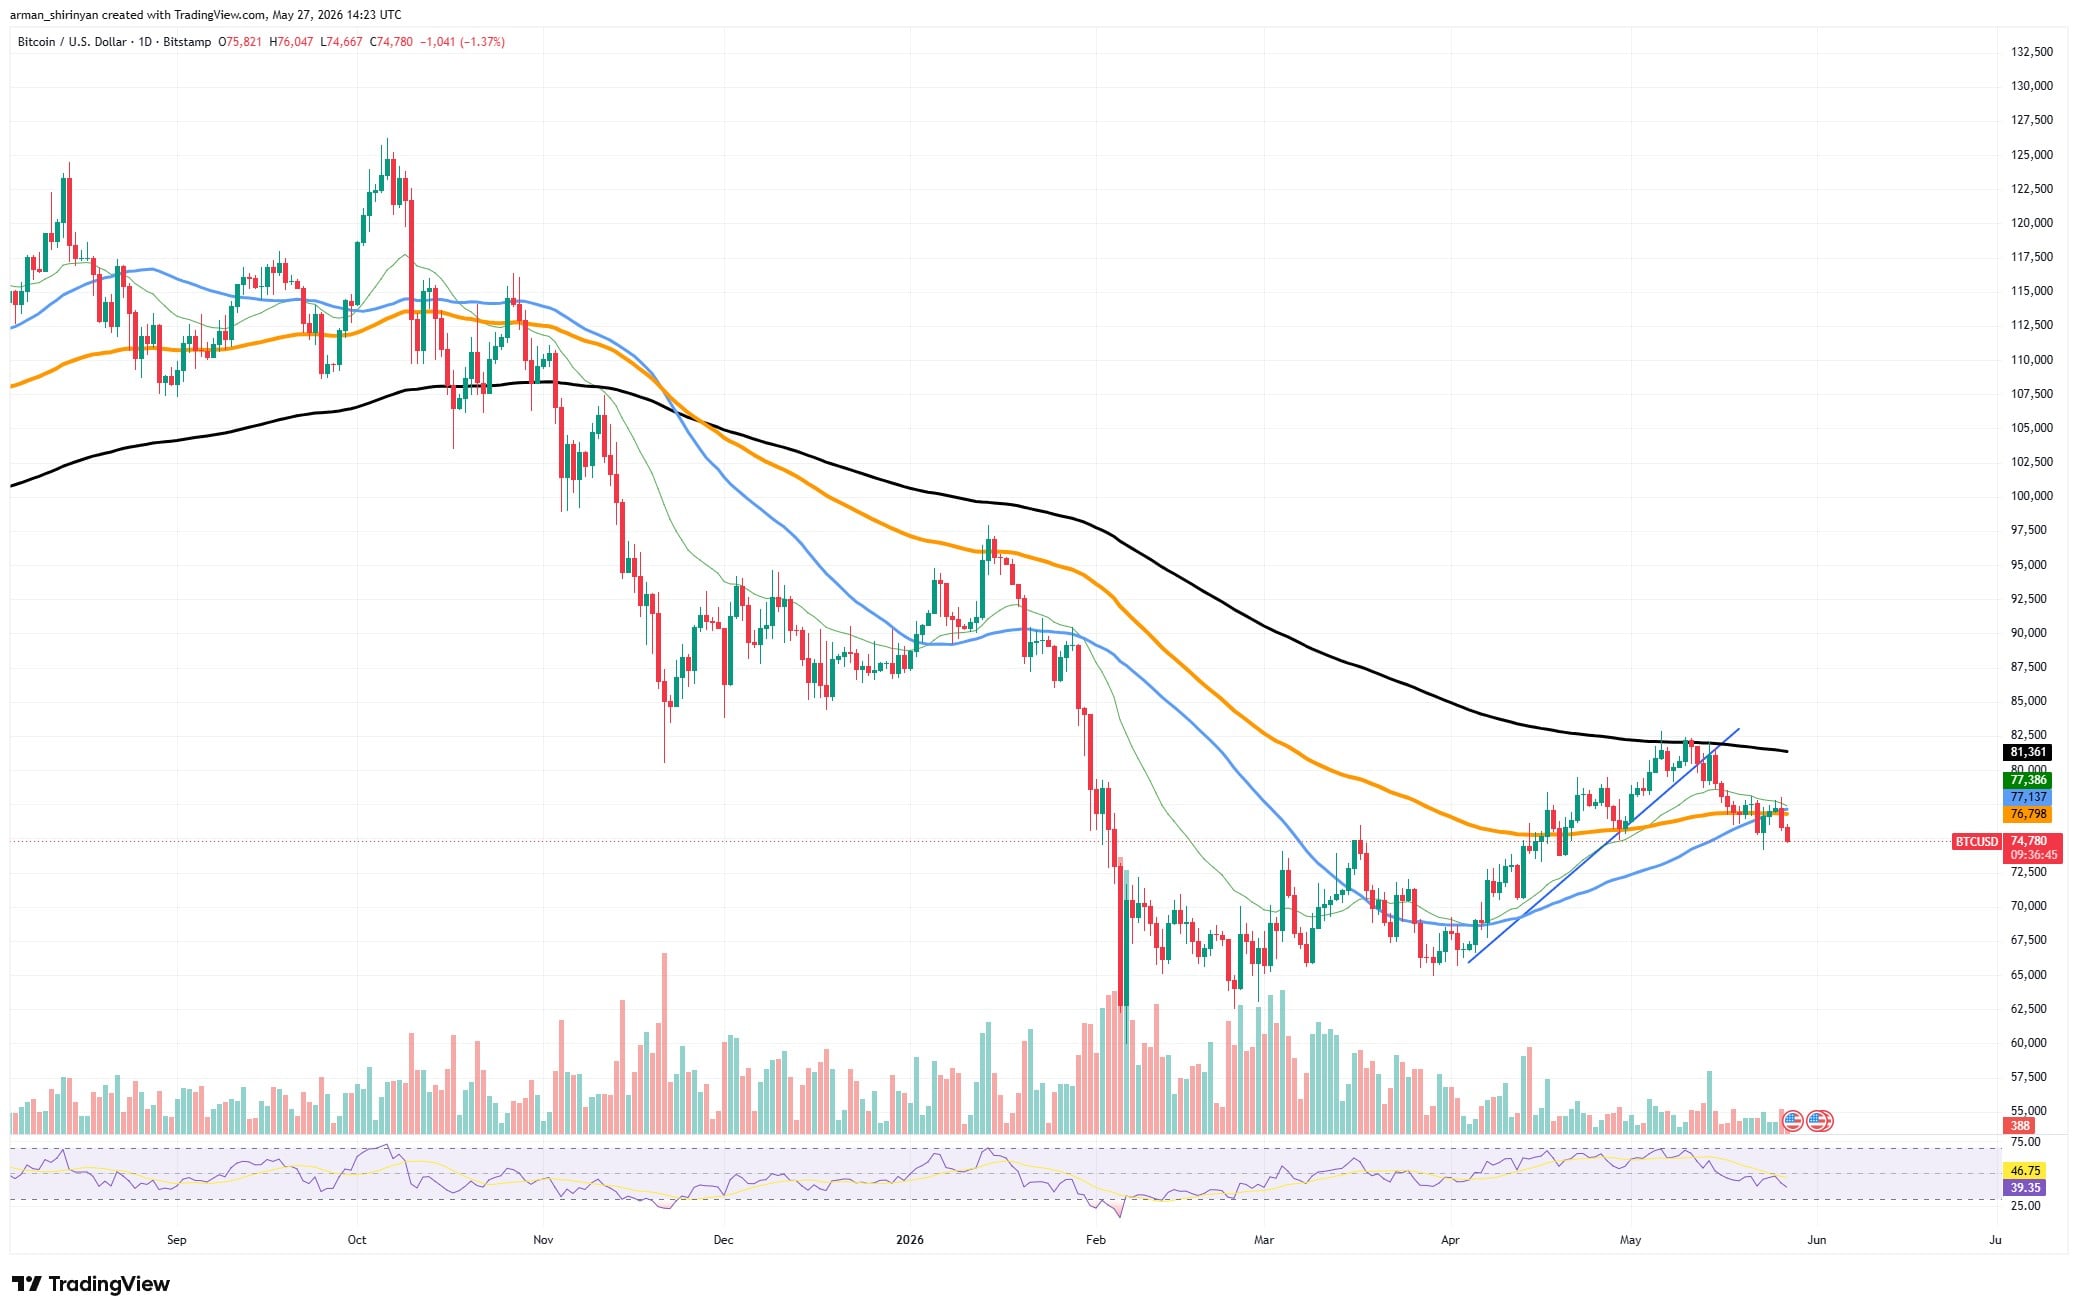
Following the May breakout attempt, buyers were unable to sustain pressure, and volume did not increase sufficiently during the push into resistance to indicate strong spot demand. A retest of the $73,000-$74,000 support zone is now indicated by the chart.

If that fails, Bitcoin is probably going to return to the high-$60,000 range where demand first surfaced earlier this year. In order to invalidate the current structure, bulls must sustainably reclaim above $82,000. The path of least resistance continues to lean sideways and downward until that point.
AI pushes NEAR higher
AI drives NEAR upward. Compared to Bitcoin, NEAR’s chart appears to be much stronger. Following months of trading in a narrow range between about $1.2 and $1.6, the price suddenly surged with high volume and broad daily candles. The move decisively reclaimed the 200-day MA and moved NEAR above all major moving averages.
This breakout, in contrast to Bitcoin, has both narrative and technical support. With its emphasis on AI infrastructure, cross-chain execution tools, and user-owned AI messaging, NEAR has placed itself squarely within the theme of the market’s recent significant rotation into AI-related cryptocurrency projects. Instead of viewing it as just another layer-1 token, traders are treating it as an AI-beta asset.
You Might Also Like

After NEAR broke through the 1.65 resistance area, the rally picked up speed. The breakout simultaneously sparked momentum buying and short covering because that level served as the primary ceiling for several months.
However, the chart is stretched in the short term. The price expanded vertically away from the moving averages as the RSI moved deep into overbought territory. This typically results in consolidation or cooling before continuing. The structure would not be harmed by a pullback in the direction of $2.1-$2.2. The trend is still positive as long as NEAR stays higher than the 200-day MA.
Instability of Dogecoin uptrends
Following the rejection from the 0.30 area, DOGE has been steadily declining for the majority of the past few months. That bigger flaw is still visible in the chart. The price is still below the 200-day moving average, and the 200-day is still sloping downward, indicating that the overall trend has not yet reversed.
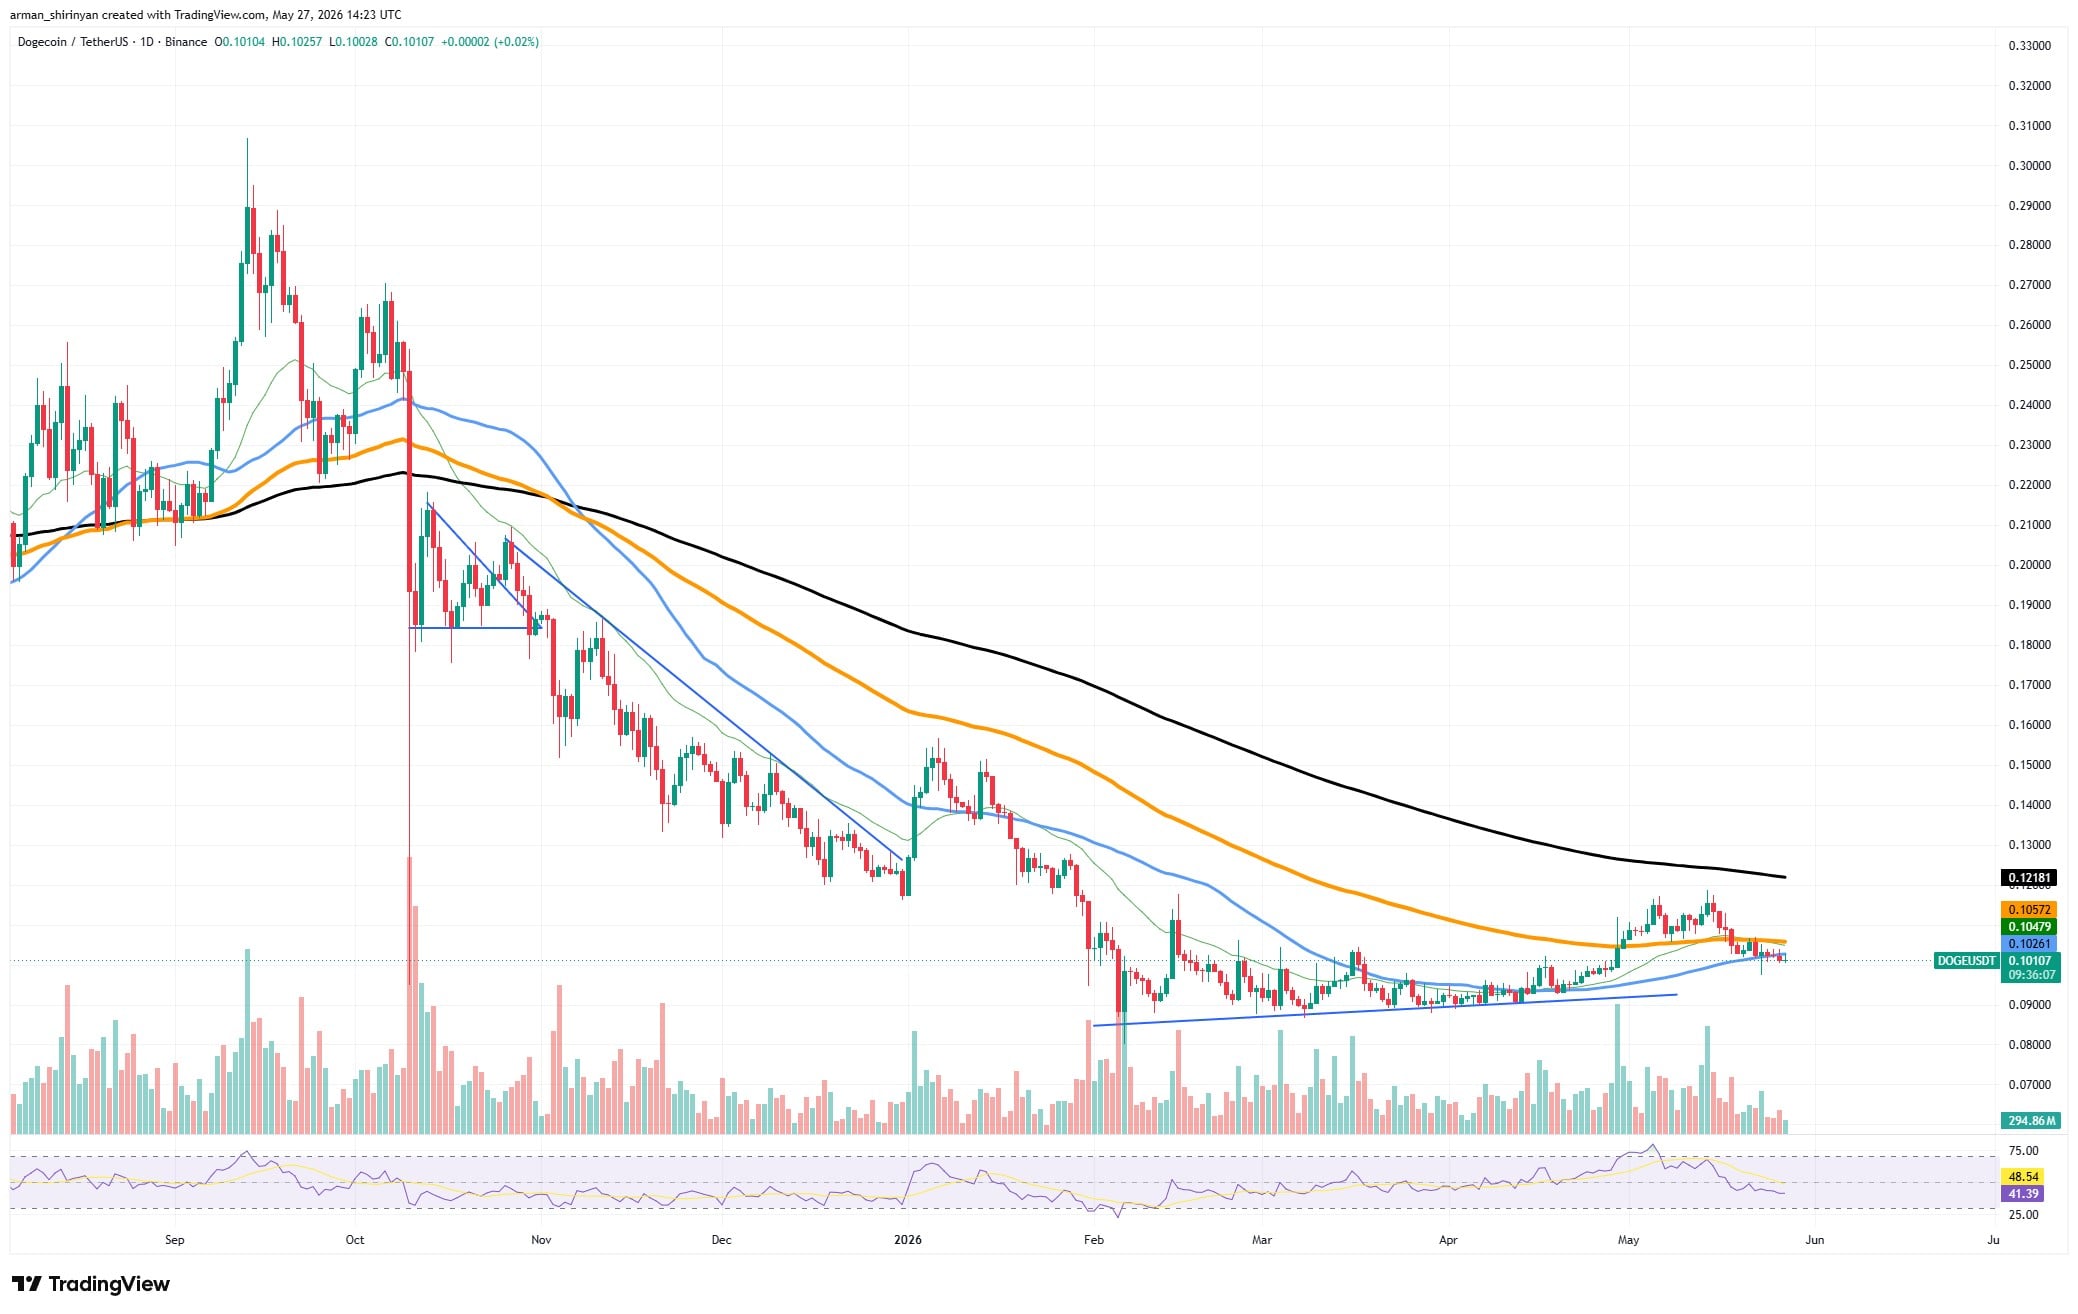
The structure close to the lows is what has recently changed. DOGE began establishing a base around 0.09–0.10 in February and stopped making aggressive lower lows. The rising trendline from the February lows indicates that buyers are gradually absorbing sell pressure rather than the price crashing right after each attempt at a rally.
DOGE briefly passed through the 0.11 area and overtook the shorter moving averages during the May breakout attempt, but the momentum soon waned. The price returned to consolidation close to the moving average cluster after failing to maintain above resistance. Additionally, the RSI dropped back below 50, indicating a decline in short-term momentum.
The chart is currently at a critical juncture. The market is likely to return to the 0.09 area if DOGE loses the rising support near 0.10. The next significant obstacle is located close to the falling 200-day MA at 0.12 if buyers defend this structure and recover 0.11 with volume. DOGE appears to be transitional rather than bullish at the moment. Although the downward trend slowed, the chart’s continuation strength is still weak.
Stellar moves forward
XLM looks weaker than DOGE structurally because it never produced a convincing reversal attempt after the larger decline started. The chart shows a persistent series of lower highs and lower lows since late 2024, with price staying trapped beneath every major moving average.
The 200-day moving average continues drifting lower, and even the shorter moving averages repeatedly rejected price during recovery attempts. Every rally during the last few months lost momentum quickly before reaching higher resistance zones.
You Might Also Like

The recent bounce from the 0.14 area is small relative to the larger decline. Volume has not expanded meaningfully, and RSI remains below the midpoint, which usually reflects weak buying pressure rather than accumulation.
Fundamentally, XLM also lacks a strong speculative driver right now. Stellar still has relevance in cross-border settlement and payment infrastructure, but the market currently favors AI-linked projects, high-beta meme assets, and ecosystems with faster user growth narratives. XLM trades more like an older-cycle payment token than a market leader.
For bulls, reclaiming 0.16-0.17 is necessary before the structure improves materially. Until then, the chart remains range-bound inside a broader bearish trend.


Be the first to comment