



What to know:
- FET shows a bullish breakout with a successful support retest, signaling strong buyer control and upward momentum.
- Technical indicators stay bullish as FET trades above the 20, 50, and 100-day EMAs, while RSI near 66 shows rising momentum.
- Despite a 24-hour drop, rising volume and liquidity suggest renewed interest and a possible reversal for FET.

The Artificial Superintelligence Alliance (FET) is showing a strong bullish breakout with a successful retest of support, rising momentum, and increased market activity, while the FET price moves above key moving averages and the trend remains upward despite nearby resistance levels that may cause short-term reactions.
At the time of writing, FET is trading at $0.2449 with a 24-hour trading volume of $294.79 million and a market capitalization of $553.1 million. Despite the 4.47% decline over the last 24 hours, the FET price structure and increasing volume point to a reversal ahead.
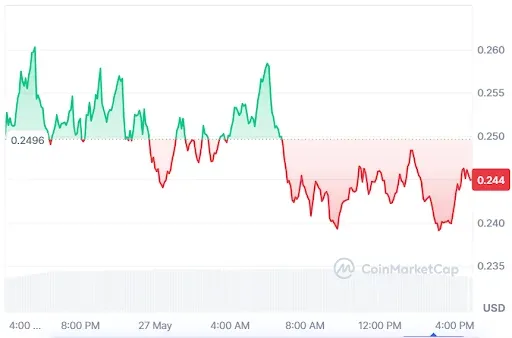
Source: CoinMarketCap

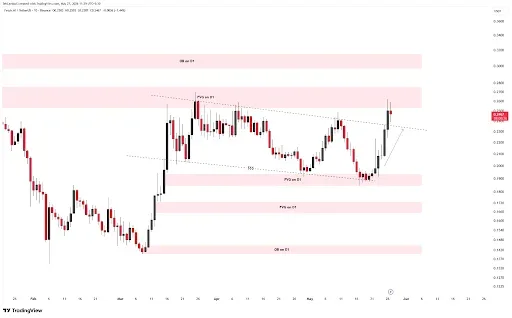
Furthermore, the crypto analyst Team LAMBO revealed that the FET price is showing strong bullish structure after a confirmed breakout on the daily timeframe.
The FET price pushed above key resistance and has now successfully retested the breakout zone, turning it into support. This behavior suggests buyers remain in control, with momentum shifting upward as market participants react to improved structure and sentiment strength continues building.
Source: Team LAMBO’s X Post
With momentum building, the next key resistance levels for the FET price are located at $0.26, which aligns with a daily fair value gap, and $0.31, which corresponds to a daily order block.
These zones may act as short-term reaction points, but overall structure remains bullish as the price discovery continues to expand upward in coming sessions ahead.
Also Read: FET Price Analysis: Strong Recovery Signals Point to a Strong Rally to $0.55
EMA’s Bullish Alignment Shows Upward Potential
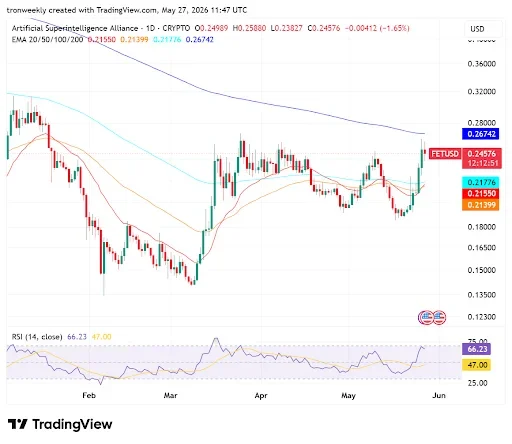
According to TradingView, the FET price has recovered from a trough of $0.13500 recorded in March. The current level is $0.24576 after breaking through its 20-, 50-, and 100-day EMAs. However, its significant 200-day EMA at $0.26742 remains an important ceiling barrier for this latest bull break.

Source: TradingView
Underneath the FET price trend, the RSI indicator has sharply increased to the 66.23 level, moving past the yellow trigger line at 47.00.
The sharp increase in the indicator clearly points towards increased buying strength. With the RSI nearing overbought conditions, it suggests that the bulls are dominating the market action.
Rising Volume Points to an Increasing Bullish Potential
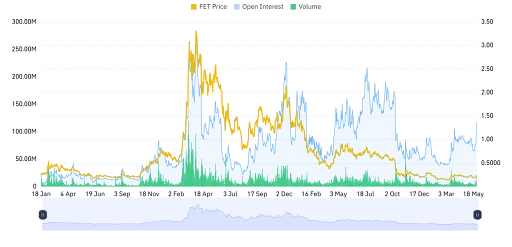
However, the volume of FET surged significantly, increasing by 27.80% and rising to $279.24 million. This indicates better liquidity conditions and increased involvement in the market as compared to the prior period.

Source: Coinglass
Open interest fell by 4.75% to $112.15 million, implying that there is a decrease in the number of contracts open in the market. This could be due to the realization of profits, closing of positions, or even a change in market sentiments.
This article contains market analysis and price predictions. These are not guarantees. Crypto markets are volatile. Always DYOR. Not financial advice.
Also Read: FET Price Analysis: Consolidation Above Support Hints at $0.70 Breakout


Be the first to comment