



Bitcoin enters another options expiry with price boxed between clear liquidity markers. The largest put interest sits near $75,000 while heavy call interest clusters around $80,000, creating a corridor where hedging flows can tug price into a narrow range. For traders, the practical question is whether this pin risk persists into the weekend and how to position around it without taking on avoidable risk.
With a sizeable front-month expiry and crowded strikes, intraday moves can be amplified or dampened by dealer hedging before and after the print. This guide breaks down why the $75k–$80k band matters now, what could break the pin, and the concrete steps to approach the next 72 hours with a plan.
| Aspect | What to Know |
|---|---|
| Size of expiry | Deribit has about 80,535 BTC option contracts (~$6.25B notional) expiring on 29 May 2026 (CoinDesk). |
| Key strikes | Largest put concentration near $75k; largest call concentration around $80k—creating prominent downside and upside liquidity walls (CoinDesk). |
| Max-pain dynamics | Dealers may hedge in ways that nudge spot toward high open-interest strikes as expiry nears; this is not deterministic but can cap ranges. |
| Who it impacts | Short-term traders, options sellers/buyers, basis traders, and hedged spot holders—especially those using leverage or tight stops. |
| Pre/post-expiry risks | Before: pin risk and IV swings. After: re-hedging and strike “air pockets” can unlock range expansion if key levels clear. |
| Notable flow signal | The BTC 29MAY26 $82k call was the most active on 21 May (≈1,600 contracts; ≈$126M notional), a sign of selective upside interest (CoinDesk). |
| Concentration zones | Recent structure notes highlight clustered liquidity near ~$75k (puts) and ~$80k (calls), with a notable front-expiry concentration (~22.4%) (OIOption). |

Core Concepts: Why Walls Matter Into Expiry
Editor’s note: Through Q1–Q2 2026 I’ve watched BTC repeatedly gravitate toward crowded strikes into Friday expiries, then reprice quickly once hedges unwind. In March we saw a clean example around mid-60k levels; desks I spoke with described sticky dealer flows that only broke after IV faded and a weekend catalyst hit. Heading into this May expiry, the $75k/$80k corridor looks similarly magnetic on my screens. My own takeaway is simple: treat pin narratives as context, but plan for the first post-expiry hour to behave very differently from the last pre-expiry hour. — Ethan Caldwell
Options open interest is not just a scoreboard—it shapes intraday liquidity. When open interest clusters at nearby strikes, market makers and dealers who hedge dynamically can dampen moves into those levels or, at times, accelerate a test of them. A visible “put wall” often behaves as a support magnet, while a heavy “call wall” can cap upside until positions roll or decay.
For the upcoming front-month expiry, the largest put concentration centers around $75,000 and the most crowded calls gather near $80,000. Reporting ahead of the event tallied roughly 80,535 BTC options (~$6.25B notional) on the slate (CoinDesk). Additional structure notes flagged a front-expiry concentration of around 22.4% and reaffirmed the $75k/$80k corridor as the dominant battleground (OIOption).
Mechanically, as spot drifts toward heavily populated strikes near expiry, hedging flows can grow more sensitive (higher gamma). Dealers short calls may sell spot as price rises toward call walls, while those short puts may buy spot as price falls toward put walls. The net of these flows can create a stabilizing band, often called “pin risk,” particularly when liquidity is average to thin.
None of this is a guarantee. A strong directional catalyst or an order-book imbalance can overwhelm hedging effects. But when the calendar, positioning, and liquidity all point the same way, pins become more likely—and that is the setup heading into this weekend.
Glossary: What You’ll Hear Traders Say
- Max pain: The price where the largest number of options would expire worthless, minimizing option buyers’ payoff.
- Put wall: A cluster of high open-interest puts at a strike that can act like support via hedging flows.
- Call wall: A cluster of high open-interest calls that can behave like resistance as dealers hedge.
- Gamma/Delta hedging: Dealer rebalancing to stay neutral as spot moves; higher gamma near expiry increases sensitivity.
- Open interest (OI): Outstanding, unexpired contracts—an indicator of where risk is parked.
- Pin risk: The tendency for spot to settle near crowded strikes into expiry due to positioning and hedging.
Step-by-Step Playbook: Navigating the Pin
- Map the corridor: Mark $75k and $80k as key bands on your chart; they host the densest put/call interest this cycle and frame likely range behavior.
- Watch OI and flows intraweek: Cross-check updated OI heatmaps and trade prints. Notably, the 29MAY26 $82k call saw heavy activity on 21 May, hinting at selective upside interest (CoinDesk).
- Limit leverage near crowded strikes: Hedging flows can whip price back and forth by hundreds of dollars. Smaller size and wider stops can reduce forced errors.
- Monitor implied volatility (IV): IV may soften as expiry nears, then reprice if the pin breaks. Align strategy with whether you need direction or volatility.
- Have a post-expiry plan: After contracts settle, re-hedging can free price from the pin. Prepare scenarios for both a range extension and a snap-back.
- Respect weekend liquidity: Order books often thin out on Saturdays. A modest market order can push price further than expected.
- Check funding and basis: Elevated perps funding or a changing spot–futures basis can signal positioning stress that precedes a range break.
- Confirm venue details: Each exchange has specific expiry mechanics and timing; synchronize your clock and avoid last-minute execution surprises.
How the $75k–$80k Corridor Can Magnetise Price
Two opposing forces shape the corridor. On the downside, the $75k put wall concentrates significant notional puts—around $394 million at that strike alone—suggesting hedging support if spot drifts lower. On the upside, the $80k call wall, with roughly $532 million in notional calls, can induce supply from dealers hedging short call exposure (CoinDesk).
Now add scale: the front-month expiry on Deribit tallies about 80,535 BTC option contracts (~$6.25B notional). In a market where a single venue anchors most listed crypto options liquidity, such concentrations can influence tape action into the print (CoinDesk). Structure briefs also point to a front-expiry concentration of about 22.4% and reaffirm the $75k/$80k band as the dominant battlefield (OIOption).
One nuance: despite the cap implied by the $80k call wall, the most-active instrument on 21 May was the 29MAY26 $82k call (~1,600 contracts; ~$126M notional), reflecting selective upside appetite that could matter if $80k breaks on strong flow (CoinDesk). This asymmetry—capped near $80k but with call activity higher—can create sharp, fleeting breakouts if hedges are forced to flip.
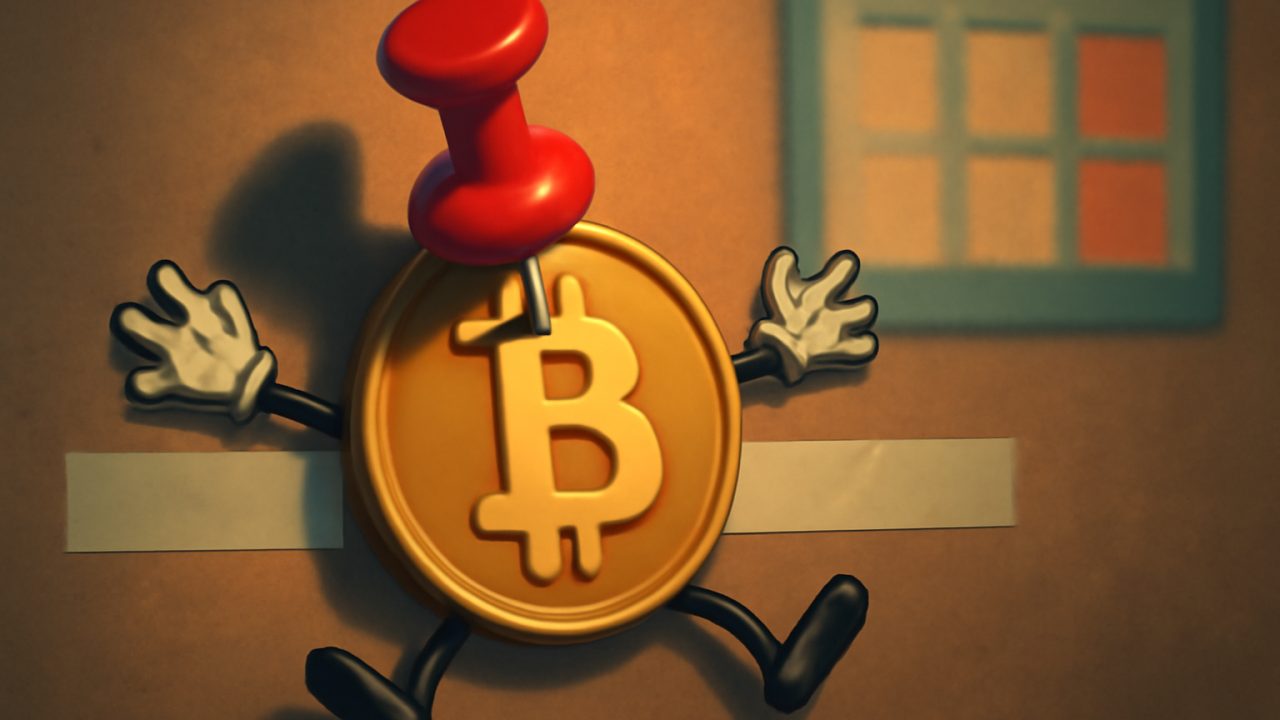
Strategy Trade-Offs in a Pin-Prone Market
If you decide to trade the narrative rather than sit flat, it helps to match position type with your core thesis: range containment, breakout, or volatility repricing. Below is a high-level comparison of common approaches. None are recommendations; each carries material risk.
| Approach | When It Fits | Main Risk | Capital/Skill |
|---|---|---|---|
| Directional spot/futures | Clear catalyst to break $75k or $80k; conviction on direction | Getting pinned and chopped; stop-outs near walls | Moderate; manage leverage, slippage |
| Long straddle/strangle | Expect IV expansion or a strong move post-expiry | IV crush into expiry; theta decay if range persists | Higher premium outlay; options know-how |
| Short iron condor | Base case is containment inside $75k–$80k band | Breakout risk; tail moves can overwhelm credit | Risk-defined but requires strict risk controls |
| Protective puts (hedge) | Long BTC holders seeking drawdown protection near $75k | Hedge cost if price pins or drifts higher | Moderate; choose strike/tenor carefully |
| Gamma scalping | Active traders exploiting micro-swings near walls | Execution-heavy; spread/fees can eat edge | Advanced; tight operational discipline |
Pro tip: Into the final hours, watch how skew and short-dated IV move as spot nears a wall. A sudden bid to calls or puts can foreshadow a hedging flip and a brief, tradable break.
What Can Break the Pin: Catalysts and Weekend Effects
Pin risk is a positioning story; catalysts rewrite it. A sharp macro headline, a large on-chain transfer interpreted as sell pressure, or a whale order ripping through thin books can overcome hedging inertia. In crypto, exchange incidents and liquidation cascades have also historically short-circuited pins.
Weekend structure matters. As Friday’s expiry clears, some dealers flatten residual deltas, and spreads in short-dated options can widen. If $80k topside gives way after the print—especially with prior activity in the $82k calls—forced hedging could chase price higher in a quick impulse before liquidity refills. Conversely, a failure at $80k that leaks back under $78k can reawaken the $75k magnet, particularly if put skew catches a bid.
Keep an eye on three tells: rising funding rates without spot follow-through (fragile longs), spot–futures basis compression (waning directional conviction), and sudden shifts in 1-day IV (a warning that the market is pricing a break). None are perfect signals, but together they frame probabilities better than a single data point.
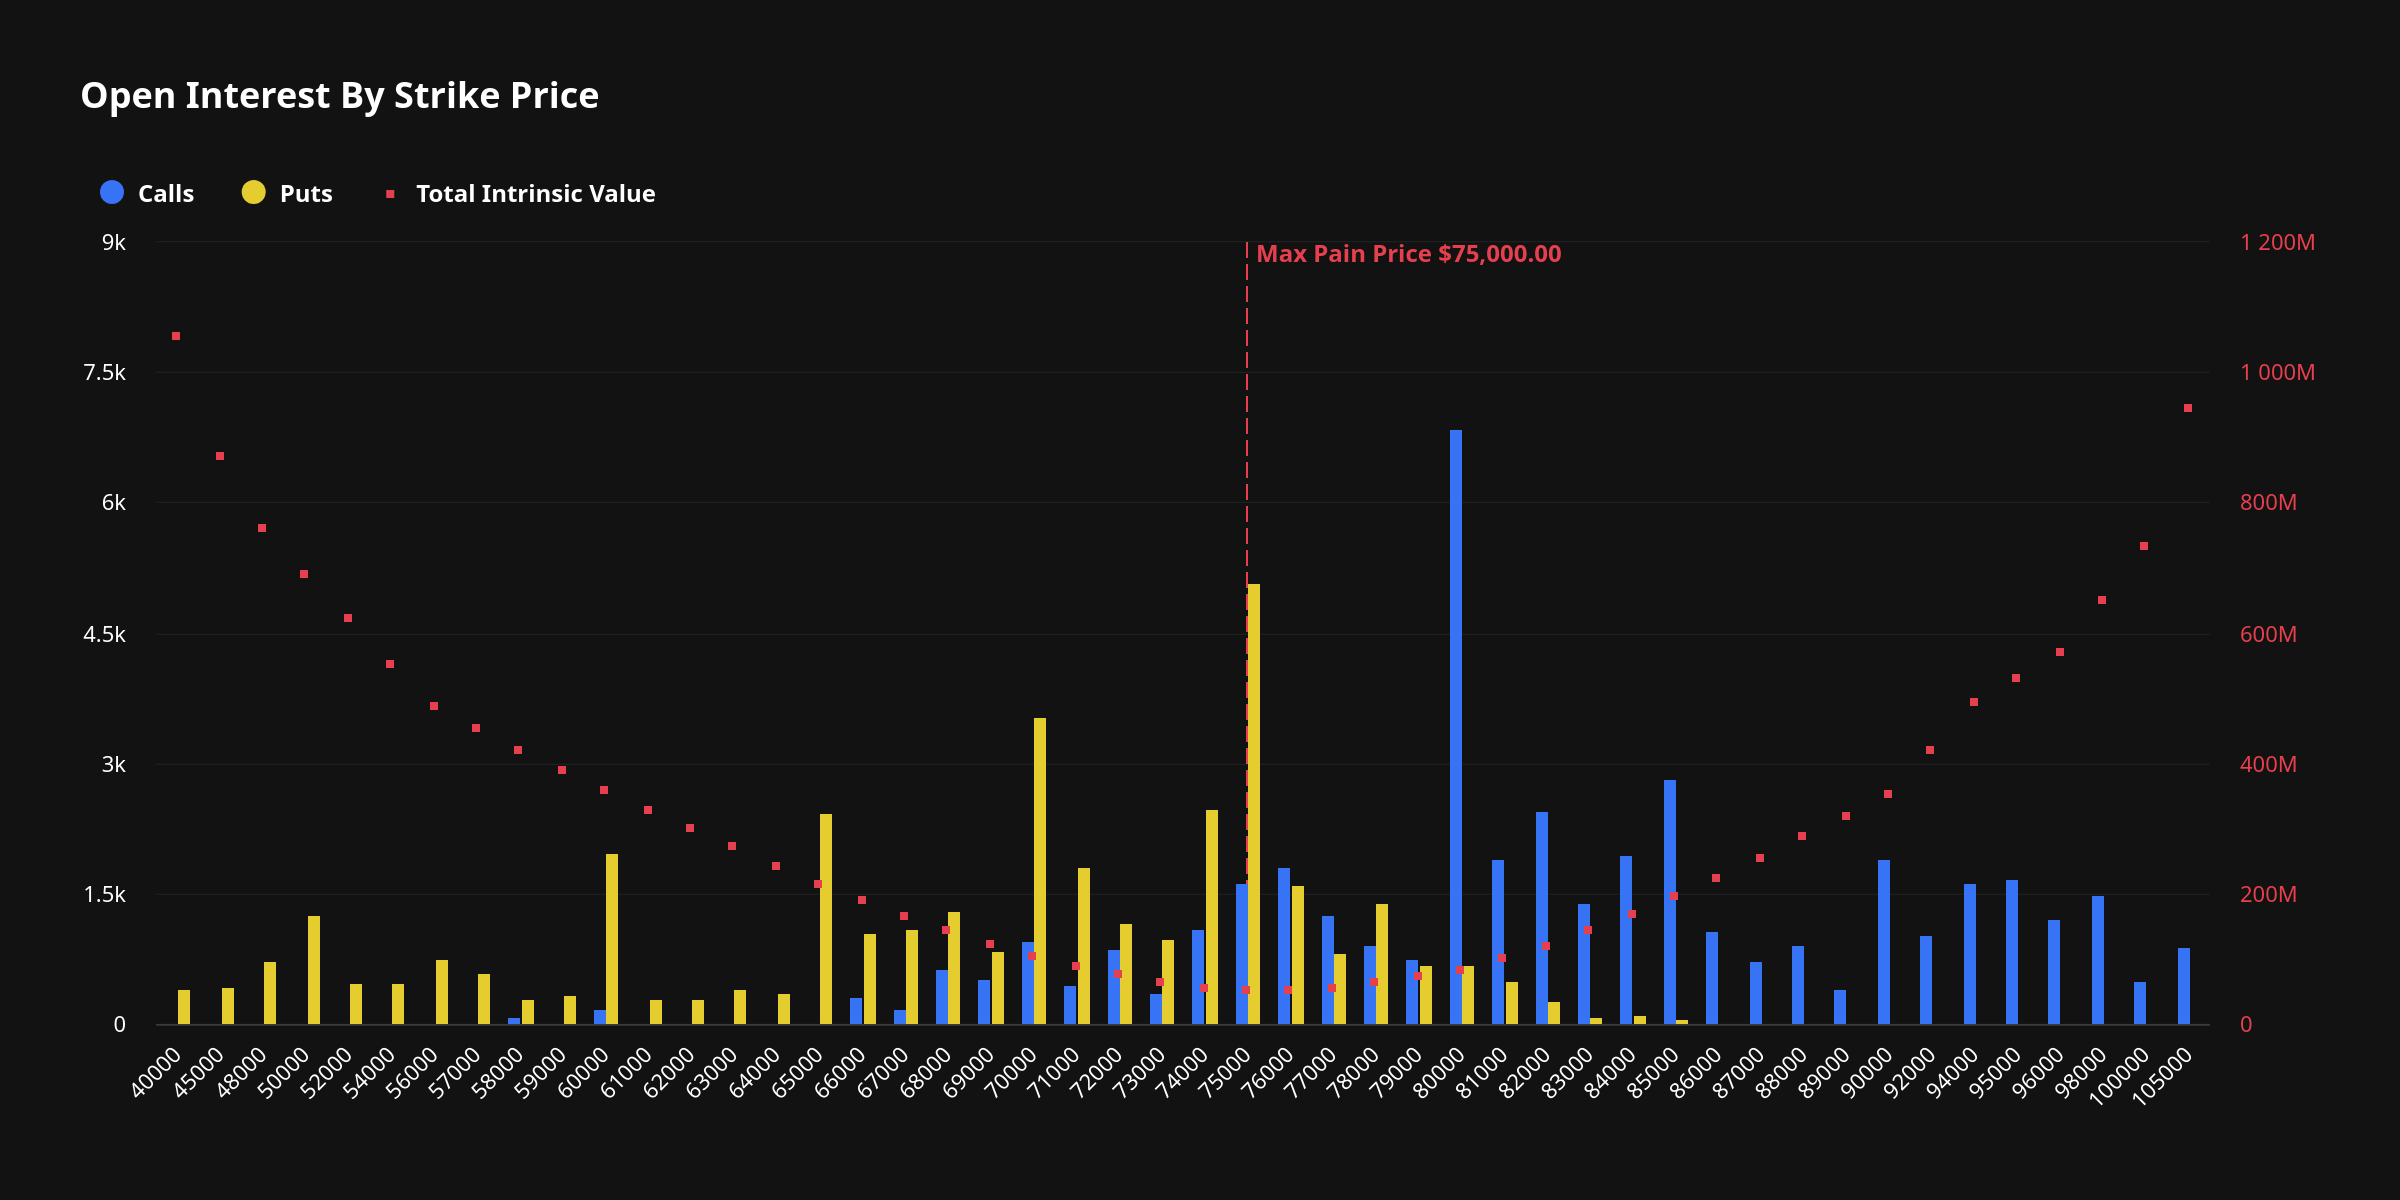
Deribit open‑interest by strike for the May 29, 2026 expiry showing the $75,000 put wall (max‑pain) and heavy call concentration around $80k–$82k — visually highlights the levels that could ‘pin’ BTC into the weekend. — Source: CoinDesk
Pitfalls & Red Flags
- Chasing the first breakout wick: Early pokes through $80k or dips toward $75k often revert if they’re hedge-driven rather than flow-driven.
- Ignoring IV crush: Buying short-dated options moments before expiry can be punished if the expected move fails to materialize.
- Overconfidence in max pain: Max pain is descriptive, not predictive. Treat it as context, not a target.
- Stale OI snapshots: Intraday rolls and closes can shift the walls. Verify with the latest data before acting.
- Weekend liquidity traps: Thin order books exaggerate moves and slippage; sizing errors become costly.
- Funding/basis blind spots: Rapid changes in perps funding or basis can front-run a pin break; monitor these continuously.
For ongoing derivatives coverage, market-structure explainers, and data-led weekend previews, visit Crypto Daily.
Frequently Asked Questions
What does a $75k “put wall” actually mean?
It indicates a heavy cluster of open-interest puts at the $75,000 strike. Into expiry, dealer hedging against those puts can create buying flows as spot approaches the level, making it behave like support. For the current cycle, reporting highlights a large put concentration around $75k (CoinDesk).
Is “max pain” a reliable price target?
No. Max pain is more of a positioning snapshot than a forecast. In quiet conditions it can coincide with settlement, but catalysts, liquidations, or strong directional flows routinely pull price away. Use it as a frame for risk, not an anchor for entries.
Why do call walls act like resistance?
When dealers are short calls at a crowded strike, they may sell spot as price rises to remain hedged, increasing supply near that level. The current $80k call wall is notable, with around $532M in call notional reported at that strike (CoinDesk).
How can I monitor the walls and flows in real time?
Use exchange dashboards for open interest by strike and expiry, options analytics platforms, and reputable market-structure briefs. Recent notes from OIOption emphasized liquidity clusters near $75k and $80k for the front expiry (OIOption).
What typically happens right after expiry?
Often, a short period of re-hedging and repositioning. If the pin clears and there’s little fresh OI at nearby strikes, price can explore new ranges quickly—especially on a low-liquidity weekend. Conversely, fresh positions can rebuild new walls that reintroduce containment.
Does the $82k call activity change the outlook?
It signals that some traders positioned for upside beyond the $80k cap into this expiry. If spot breaches $80k on strong flow, those calls could be part of a fast extension toward the low-$80ks. But without follow-through, the $80k wall can still suppress rallies (CoinDesk).
Should long-term investors react to pin narratives?
Long-term holders often treat expiry pins as noise unless they need to hedge near-term liabilities. The key is ensuring your risk, time horizon, and liquidity needs are aligned—short-term positioning effects rarely change multi-quarter theses by themselves.
Disclaimer: This article is provided for informational purposes only. It is not offered or intended to be used as legal, tax, investment, financial, or other advice.






Be the first to comment