



The market split with the Nasdaq remains a key focus. Traders continue to watch for either a Bitcoin rebound or a pullback in equities.
Bitcoin is trading weaker while the Nasdaq continues to move higher, creating a fresh split between crypto and equity markets.
Bitcoin has lost about 12% since mid-month, while the Nasdaq printed new highs as the two markets diverged.
Bitcoin Trails Nasdaq Strength
Bitcoin traded near $73,191 on the daily chart, down slightly during the latest session. The move placed Bitcoin below a key Fibonacci level at $75,712.

The weakness comes as the Nasdaq continues to show strength. Michaël van de Poppe said the two assets have moved in different directions since mid-month.
Bitcoin has failed to match the equity rally during recent sessions. This has raised debate about whether crypto will recover or equities will weaken.
#Bitcoin gets beaten down, while the Nasdaq goes up.
Again, since the middle of this month, we’ve seen a disparity between the price action of Bitcoin and the price action of the Nasdaq.
The Nasdaq has been printing new highs, and Bitcoin has lost 12% in value since that… pic.twitter.com/dqrKWDzcdw
— Michaël van de Poppe (@CryptoMichNL) May 29, 2026
Michaël van de Poppe said, “Bitcoin gets beaten down, while the Nasdaq goes up.” The same comment said the gap has widened in recent days.
The Nasdaq has made new highs, while Bitcoin has lost ground. Traders are now watching which market adjusts next.
Analysts Debate Market Catch-Up
Michaël van de Poppe said one of the two markets may need to catch up. That view is based on the recent split between Bitcoin and technology stocks.
One scenario is that the Nasdaq weakens and follows Bitcoin lower. Analysts compared this with February, when Bitcoin started falling before broader risk assets.
Another scenario is that Bitcoin rebounds in the coming weeks. Some analysts said the recent weakness may reflect month-end rebalancing or profit taking.
Michaël van de Poppe said, “I do think it’s the latter.” It also noted that markets remain shaky at current levels.
The timing has added to the debate. Some traders have pointed to a pattern of stronger early-month moves and weaker late-month trading.
This view has not been confirmed by price action yet. Bitcoin must reclaim key levels before the rebound case gains more support.
Read Also:
Bitcoin Whales Move Millions as ETFs Lose $101M: BTC Price Holds $77K
Bitcoin Tests Key Technical Levels
Bitcoin remains below the larger Fibonacci range drawn from $62,373 to $124,703. The chart shows a sharp reversal after price reached the upper range.
The first major resistance now sits near $75,712 to $76,000. A daily close above that zone could improve the short-term setup.
If buyers regain that level, Bitcoin could move toward $86,183. That level matches the 0.618 Fibonacci retracement on the chart.
Further resistance appears near $93,538, $100,893, and $109,993. These levels may slow any recovery attempt.
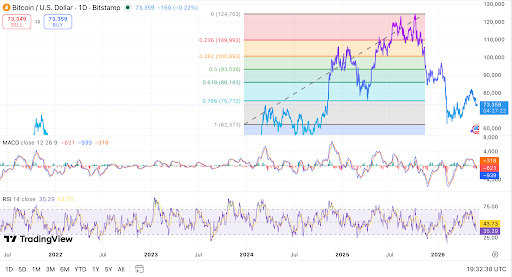
Support remains near $62,373 to $65,000. A break below that area would weaken the broader retracement structure.
Momentum remains soft on the daily chart. The MACD line is below the signal line, and the histogram is negative.
The RSI is near 34.83, while its moving average is around 43.70. This shows weak buyer strength, though it is not deeply oversold.
Bitcoin’s next move may depend on whether it can regain $75,712. Until then, the chart shows short-term pressure.



Be the first to comment