


What to know:
- ALGO formed a bullish “W” pattern after rebounding, with analysts targeting a move toward $0.135.
- ALGO faces resistance at the 100-day and 200-day EMAs, making this zone crucial for trend confirmation.
- Rising open interest in Algorand futures shows growing trader confidence, though failure may lead to sideways consolidation.

Algorand (ALGO) is showing signs of a bullish reversal as it approaches key resistance after a strong rebound from recent lows. Rising trading activity and growing market participation indicate improving momentum, though failure to break resistance could keep the ALGO price moving within a sideways range.
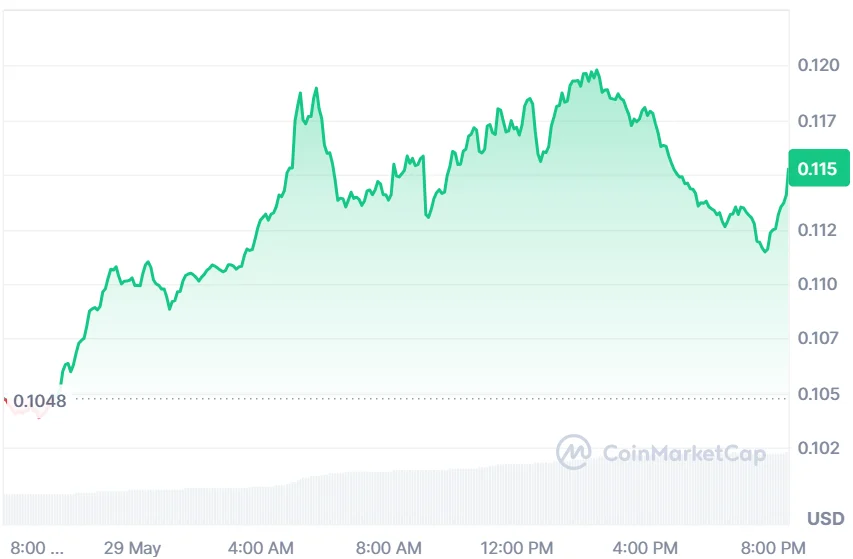
At the time of writing, ALGO is trading at $0.1147 with a 24-hour trading volume of $98.23 million and a market capitalization of $1.02 billion. Following the 10.14% gain over the last 24 hours, the ALGO price structure points to a bullish reversal.

Source: CoinMarketCap

ALGO Price Signals Bullish Reversal as Breakout Nears
Furthermore, the crypto analyst Alpha Crypto Signal pointed out that the ALGO price is showing signs of a potential bullish reversal after forming a W pattern following a strong rebound from recent lows.
The ALGO price is now approaching a crucial neckline resistance zone, where traders are watching closely for confirmation. A successful breakout could signal renewed buying momentum and shift short-term market sentiment back toward bullish control.

Source: Alpha Crypto Signal’s X Post
While all this is taking place, there comes a very significant test for ALGO on its resistance levels, after which the ALGO price will give its green signal for an extended rally.
It is advised that any clean break above this neckline level may see the ALGO price pushing towards the $0.135 region, but a rejection at these levels will see the coin trapped in a range-bound move.
Also Read: ALGO Price Prediction: Consolidation Phase Hints at Potential Rally to $0.15
Algo Faces Resistance at 100-day Moving Average
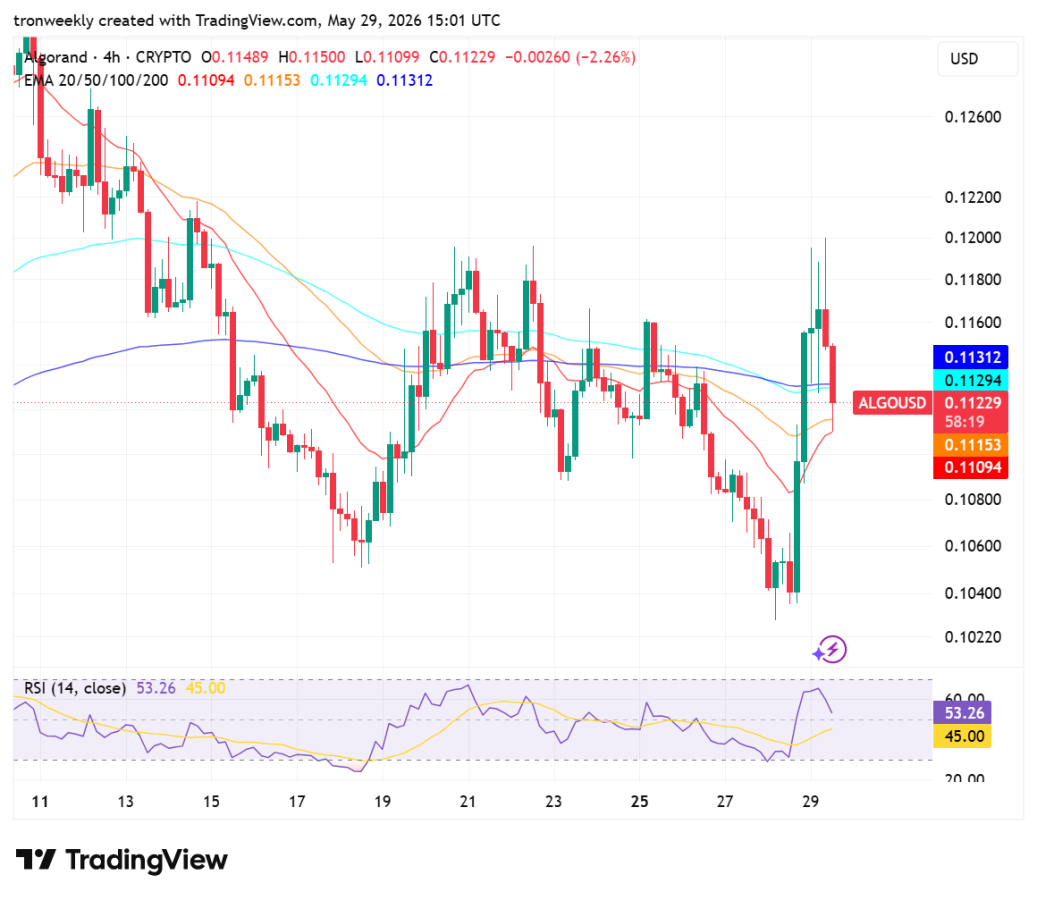
According to TradingView, the ALGO price chart showed a steep decline from a peak of 0.12600 to a bottom of 0.10400, after which came a strong recovery.
Currently, the coin is trading at around 0.11229, which represents a decline of 2.26%. The digital asset faces dynamic resistance close to the 100 and 200 EMAs at 0.11294 and 0.11.

Source: TradingView
RSI 14 is currently at 53.26, which is a neutral position. The indicator peaked at around 60.00 because there was heavy buying pressure that sent the price above its most recent lows.
While it suggests that the oversold situation has ended, momentum has been lost amid seller pressure towards the moving average cluster.
ALGO Derivative Data Point to Increasing Momentum
However, the ALGO open interest increased by 11.84% to a maximum of $52.39 million. The increase shows that there is increased creation of trading positions by traders. This indicates increased investor confidence in the markets.

Source: Coinglass
There is an unprecedented increase in the trading level, with the volume increasing by 84.55% to $136.28 million. This indicates that many more people are getting involved in the market, hence a positive momentum and liquidity of the market.
This article contains market analysis and price predictions. These are not guarantees. Crypto markets are volatile. Always DYOR. Not financial advice.
Also Read: ALGO Price Analysis: Accumulation Zone Points to a Breakout Toward $2.02



Be the first to comment