


As the asset continues to push against a long-standing support zone close to $1.30, XRP is trading at a crucial technical level.
There isn’t much room for bulls to absorb further selling pressure because price action is currently testing the lower boundary of the structure after months inside a descending triangle formation.
Since March, the chart has shown a number of lower highs, indicating that sellers are still in charge of the overall trend. The 50-day and 100-day moving averages continue to serve as overhead barriers, and every attempt at a rally has been thwarted close to the declining resistance line. Additionally, XRP is still significantly below the 200-day moving average, which emphasizes how weak the long-term trend is.

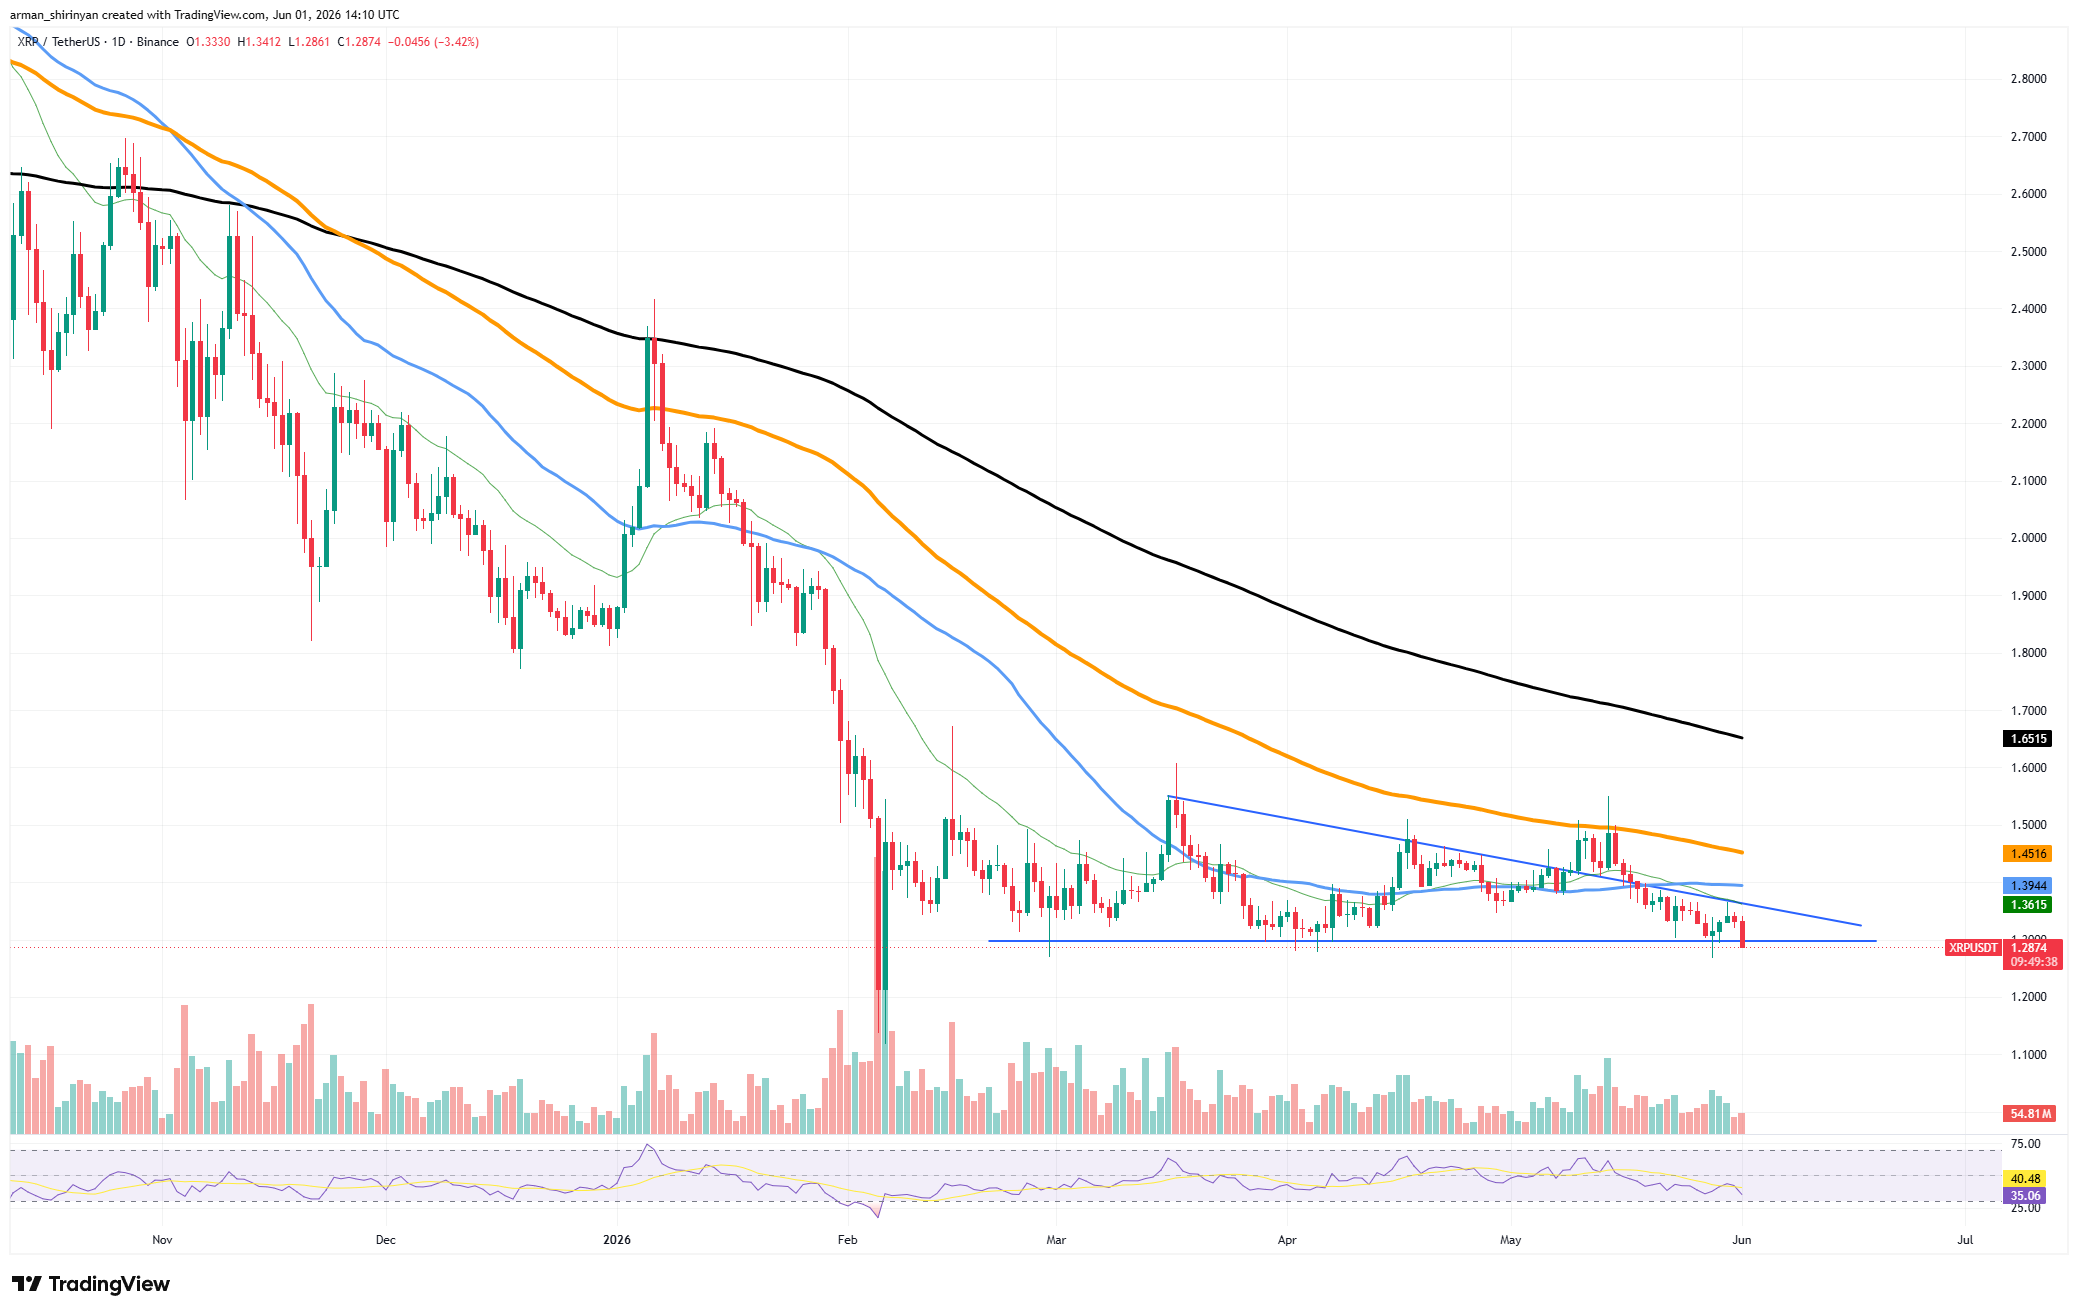
Momentum indicators provide little hope. The Relative Strength Index has dropped into the mid-30s, getting close to oversold territory but not quite to levels that are usually linked to surrender. This implies that before a significant relief rally occurs, downside pressure may persist.
$1.30 is the important level to keep an eye on. The descending triangle would be completed by a clear breakdown below this support, which might also set off another wave of selling in the direction of lower support zones.
On the other hand, XRP might stay stuck in consolidation while gathering momentum for a bigger move if buyers are successful in defending the region once more.
Bears continue to hold the upper hand for the time being, and from a technical standpoint, XRP is still one of the weaker large-cap cryptocurrencies.
At least Shiba Inu’s support is rising
After a protracted decline, Shiba Inu is in a similar predicament as it tries to maintain its rising support line.
A potentially bullish continuation setup was essentially invalidated when recent selling pressure forced SHIB out of a rising wedge structure that had been forming since March.
SHIB is currently trading close to $0.0000054, where it is trying to stabilize right on top of a support trendline that has been acting as a floor for several months.
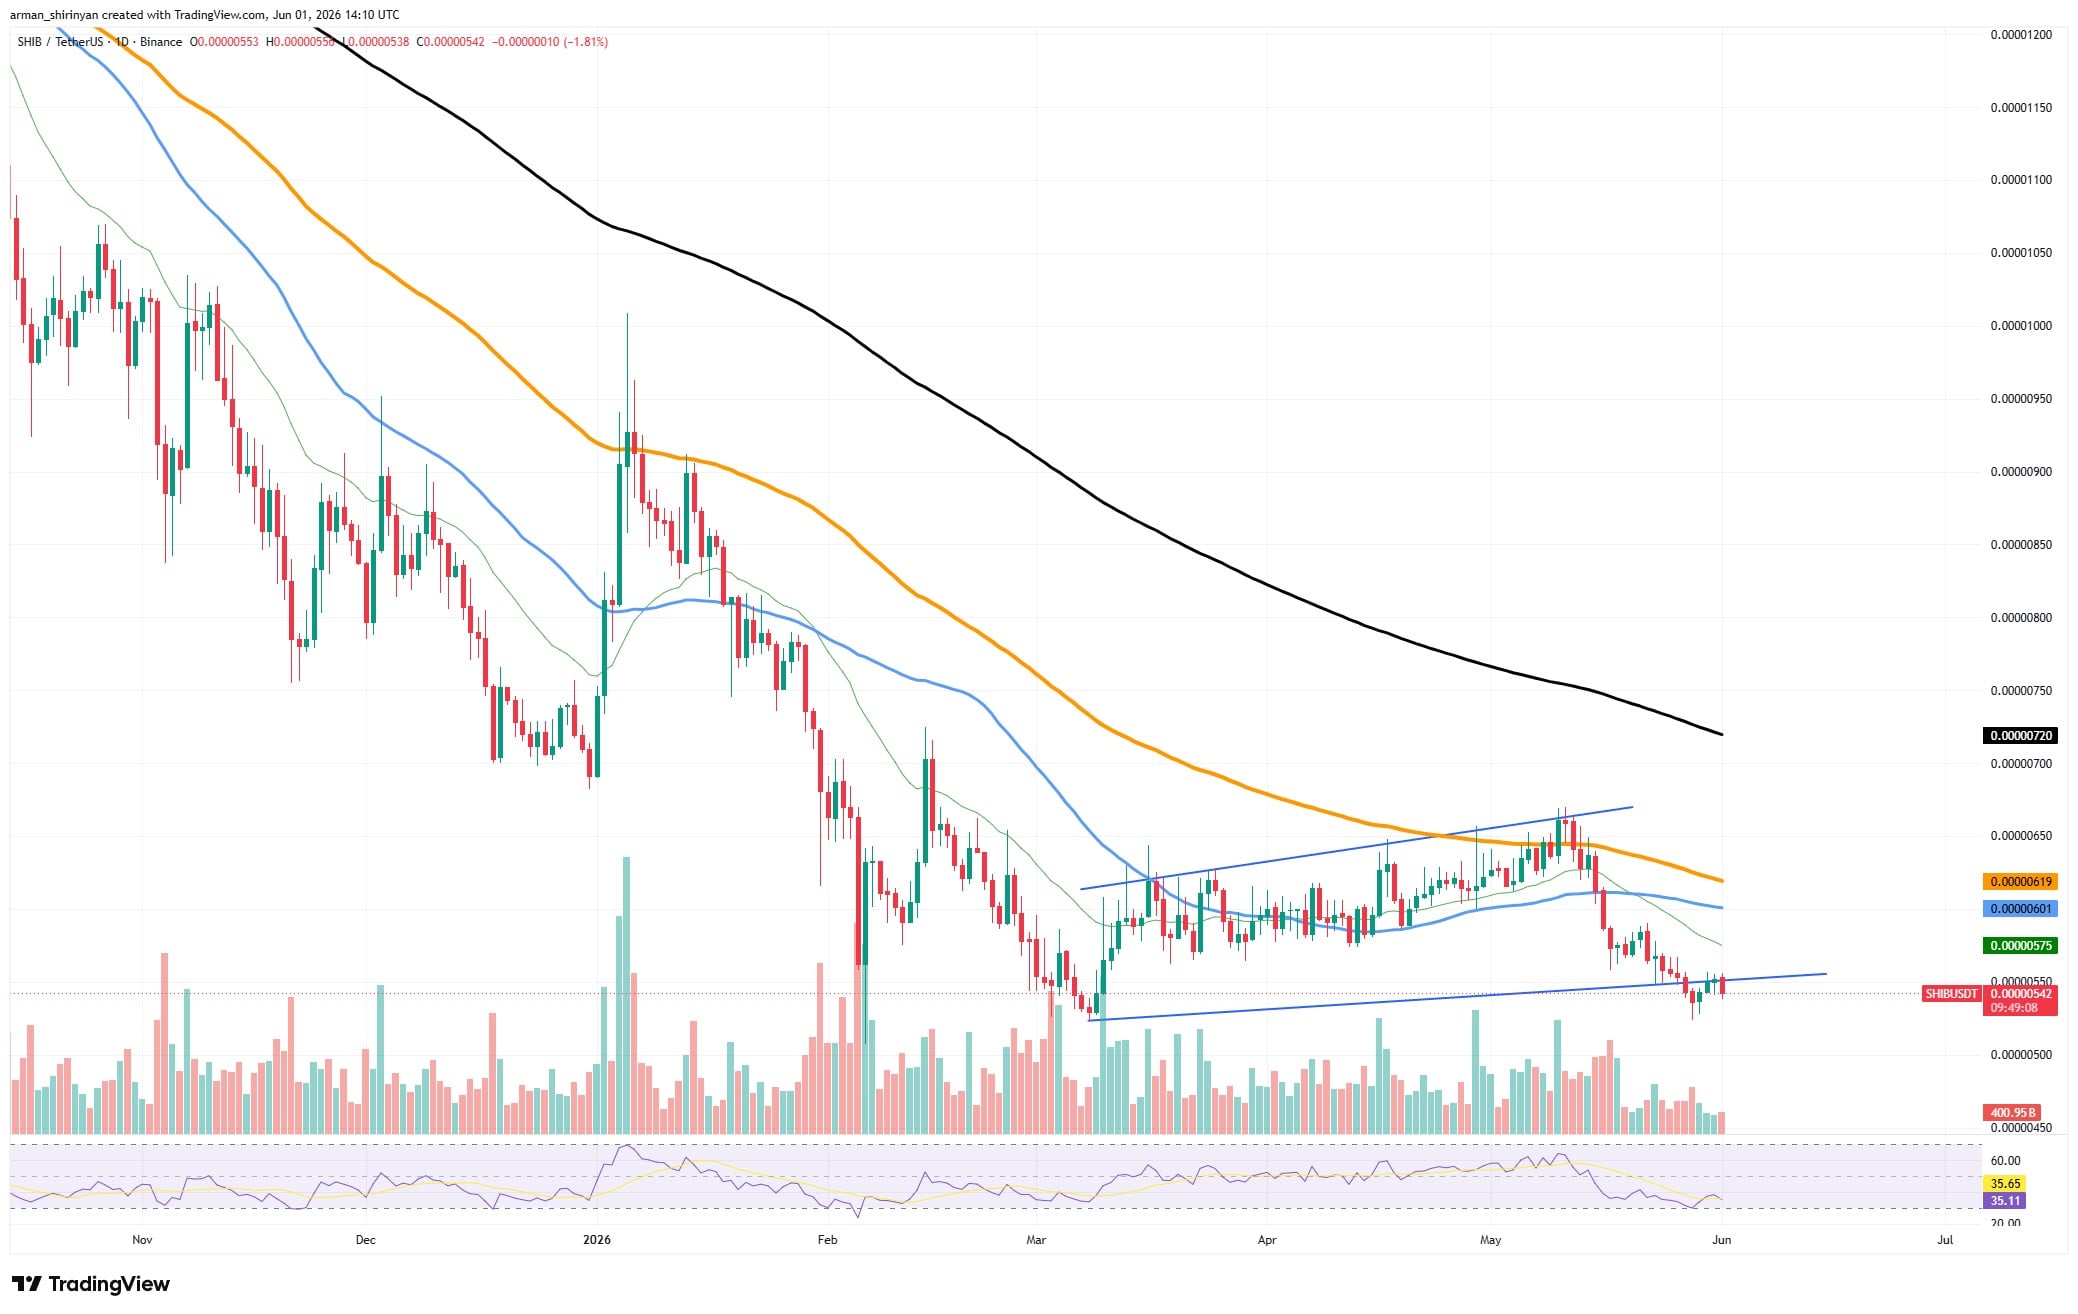
The larger technical structure is still overwhelmingly bearish, which is a problem for bulls. SHIB’s 50-day, 100-day, and 200-day moving averages are all declining, and it is still trading below them.
Additional pressure has been added by on-chain developments. Following significant inflows back into exchanges, which increased available supply and undermined the supply-shock narrative that many investors had been following, exchange reserves recently moved back above 80 trillion SHIB.
With the RSI at about 35, SHIB is on the verge of being oversold. Although this might encourage a brief recovery, previous oversold readings during the current decline have typically only resulted in brief relief rallies.
The most crucial region on the chart right now is the support zone close to current levels. If SHIB loses it, traders may give up on a near-term reversal, which could cause the market to swiftly accelerate lower.
However, SHIB might be able to attempt another recovery toward the moving averages overhead if the defense is successful.
Although SHIB is still technically weak at the moment, unlike XRP, it is right on a support level that could still result in a short-term recovery if overall market conditions improve.
Bitcoin tumbles to the old support
Bitcoin’s recent correction is accelerating as the market leader loses critical technical levels that previously supported its recovery attempt. After failing to hold above the 50-day and 100-day moving averages, BTC has now dropped toward the $71,000-$72,000 region, placing bulls in a difficult position.
You Might Also Like

The most concerning development is the breakdown below the ascending trendline that guided Bitcoin’s rally from April lows. That trendline served as the backbone of the recovery structure, and its loss significantly weakens the bullish case in the short term. What initially looked like a healthy pullback has evolved into a broader deterioration of market structure.
Technically, Bitcoin now trades below the 50-day, 100-day, and 200-day moving averages. The cluster of moving averages between $76,000 and $80,000 has transformed into a major resistance zone that buyers will need to reclaim before any sustainable recovery can begin.
Momentum indicators paint a similarly cautious picture. The RSI has fallen to approximately 31, placing Bitcoin firmly in oversold territory. While such readings often precede relief rallies, they do not guarantee an immediate reversal. During strong downtrends, assets can remain oversold for extended periods.
The next major support sits near the current range around $70,000-$72,000. A failure to hold this zone could expose Bitcoin to a deeper correction, while a successful defense may allow the market to attempt a technical bounce.
For now, the trend favors sellers, and Bitcoin’s ability to stabilize near current levels will likely determine the direction of the broader crypto market in the coming weeks.
Dogecoin’s trend isn’t changing
Dogecoin recently broke below an ascending trendline that had supported price action since February. The breakdown effectively ended DOGE’s medium-term recovery structure and shifted momentum back toward bears. Since then, every rebound attempt has been met with renewed selling pressure.
You Might Also Like

DOGE is currently trading just below its 50-day moving average and remains trapped beneath the 100-day and 200-day moving averages. The inability to reclaim these levels highlights the lack of bullish conviction in the market despite occasional spikes in volume.
The technical outlook remains fragile. The RSI has slipped toward 40, indicating weakening momentum but not yet reaching deeply oversold conditions. This leaves room for additional downside pressure if broader market sentiment continues deteriorating.
The $0.10 level now represents the most important battleground on the chart. It is both a psychological support and a historically significant trading area. Losing it would likely trigger additional selling and could push DOGE toward lower support zones not seen since the first quarter.
On the positive side, DOGE has not completely collapsed following the trendline break. Price continues to consolidate near support rather than accelerating downward, suggesting some buyers are still defending the area.
The coming days should provide clarity. If DOGE can reclaim the short-term moving averages and move back above $0.103-$0.105, a relief rally could emerge. Otherwise, the breakdown may mark the beginning of another leg lower for the asset.

Be the first to comment