


What to know:
- XLM price weakened as traders tracked support after the latest market rally cooled.
- TD Sequential issued a sell signal after XLM rallied sharply over a two-week period.
- EMA levels stayed below XLM price as Bollinger Bands showed wider market volatility.

XLM price moved lower on Tuesday, June 2, 2026, as Stellar cooled after a strong market rally. Traders remained attentive to the possibility of recent gains being held following technical signals turning cautious near the local high.
As of writing, Stellar (XLM) is trading at $0.22.96, showing a decline of 14.26% in the past day. The trading volume is also down by 21.68% and is currently standing at $1.18 billion. Over the last week, the XLM price has increased by 54.61%, according to CoinMarketCap.
Also Read: TRX Price Eyes $0.366 Breakout as Inverse Head and Shoulders Pattern Forms

XLM Price Faces Caution After 107% Rally
Crypto analyst Ali Martinez pointed out a caution signal on the daily chart. According to him, XLM has increased by 107% in the last two weeks, prior to the recent pullback.
He added that the XLM price rally was signaled earlier by the daily TD Sequential indicator. The buy signal appeared before Stellar moved from $0.14 to a local high near $0.30.

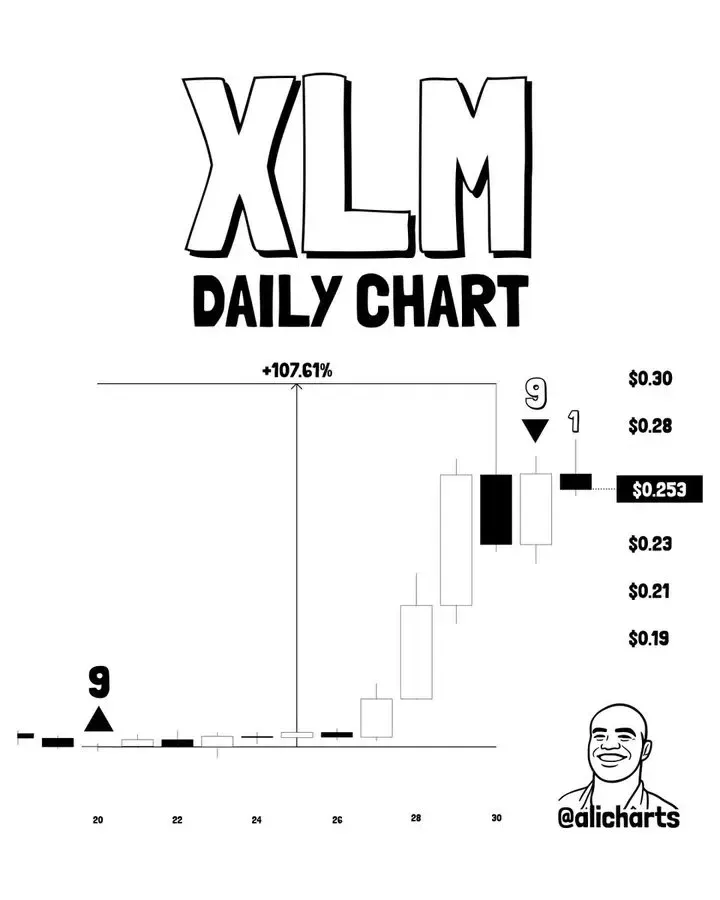
Martinez noted that the same TD Sequential indicator has now issued a sell signal after the sharp rally. He added that XLM’s reaction near local highs could lead to a pullback toward $0.20.
Moreover, another analyst, Zach Humphries, mentioned that the chart is showing accumulation before an expansion phase. He identified a horizontal range between $0.136 and $0.180 that had held price action since February.
The recent bounce from range lows showed buying interest. The break above $0.180 reflected a significant change in the overall chart pattern, Humphries added. He noted that holding above that former range ceiling could validate his projected target of $0.340 by July.


XLM Futures Volume Drops as Open Interest Falls
Derivatives activity also weakened during the pullback. CoinGlass data shows that the futures volume is down by 30.13% to $1.68 billion, while open interest fell 15.40% to $321.31 million.
The XLM OI-weighted funding rate was 0.0073%. The figures indicated decreased participation following the recent rally, and funding remained positive.
XLM Price Holds Above Key EMAs After Pullback
TradingView data showed the 20-day Exponential Moving Average (EMA) was at $0.191789. The 50-day EMA stood at $0.175303. The price of XLM was still trading near-term trend levels as both short-term averages were below the current price.
The 100-day EMA is at $0.176155, while the 200-day EMA stands at $0.198959. On the daily time frame, the XLM price was above both long-term EMAs. This showed that the moving-average structure remained firm despite the latest pullback.
The Bollinger Bands (BB) showed the upper Bollinger Band at $0.260178. The middle band stood at $0.176265, and the lower band was $0.092353. The XLM price was below the upper band and above the middle band.
Also Read: Ethereum Price Nears Critical Support as Bulls Eye $2,360 Resistance Zone

Be the first to comment