


The defunct exchange moved $739 million in Bitcoin this morning. Two previous transfers tell very different stories about what might follow.
Key Takeaways:
- Mt. Gox moved 10,422.64 BTC worth $739M.
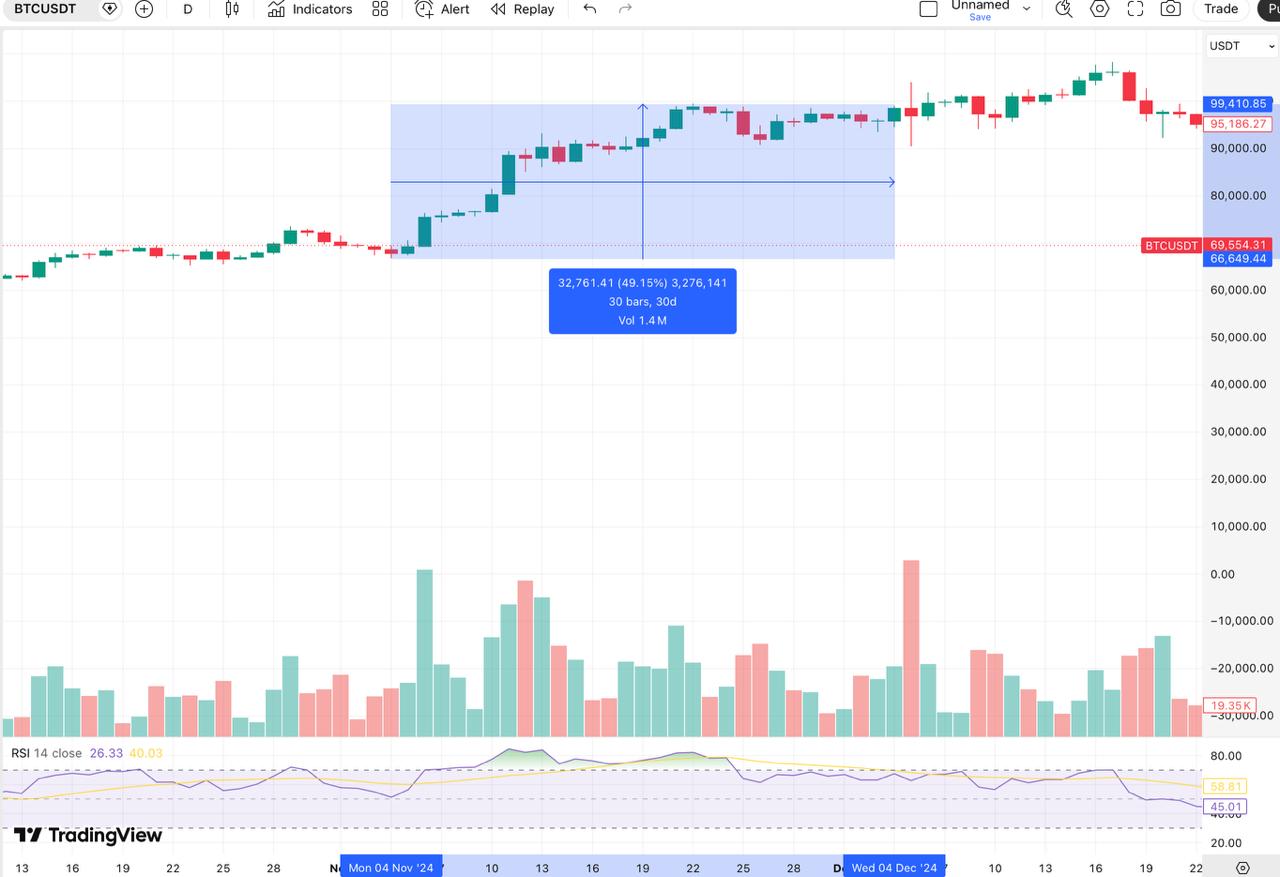
- November 2024 transfer of 32,371 BTC preceded a 34.66% gain in 7 days and 49.15% in 30 days.
- November 2025 transfer of 10,608 BTC preceded a 15.54% drop in 4 days and 11.44% over 31 days.
- Bitcoin currently trading at $69,400, below the psychological $70,000 level.
Blockchain monitoring flagged a split-stream movement from the Mt. Gox estate at 04:47 UTC on June 2, 2026. Rather than a straightforward lump-sum transfer, the on-chain data tracked by Arkham Intelligence shows a deliberate division: 10,306 BTC worth $730.78 million was routed to a brand new address with no prior transaction history, while a smaller 116 BTC worth $8.25 million went directly to a known Mt. Gox hot wallet and has already been marked as spent.
The split matters. The bulk going to an unseen address leaves its purpose ambiguous, whether creditor distribution preparation or internal reorganization remains unclear. The smaller slice hitting the hot wallet suggests at least some portion was earmarked for immediate operational use. Following the transfer, the estate still holds approximately 34,504 BTC worth roughly $2.43 billion, with the final distribution deadline set for October 31, 2026. Roughly 19,500 creditors have already been paid.
Two Previous Transfers, Two Opposite Outcomes
To understand what this kind of movement has historically meant for price, it is worth looking at two notable previous instances where Mt. Gox made comparable large transfers. They went in completely opposite directions, and the reason why tells the more important story.
The first was November 4, 2024: 32,371 BTC worth $2.19 billion moved to unmarked wallets and internal cold storage. Over the following seven days Bitcoin gained 34.66%, adding approximately $23,032 to its price.
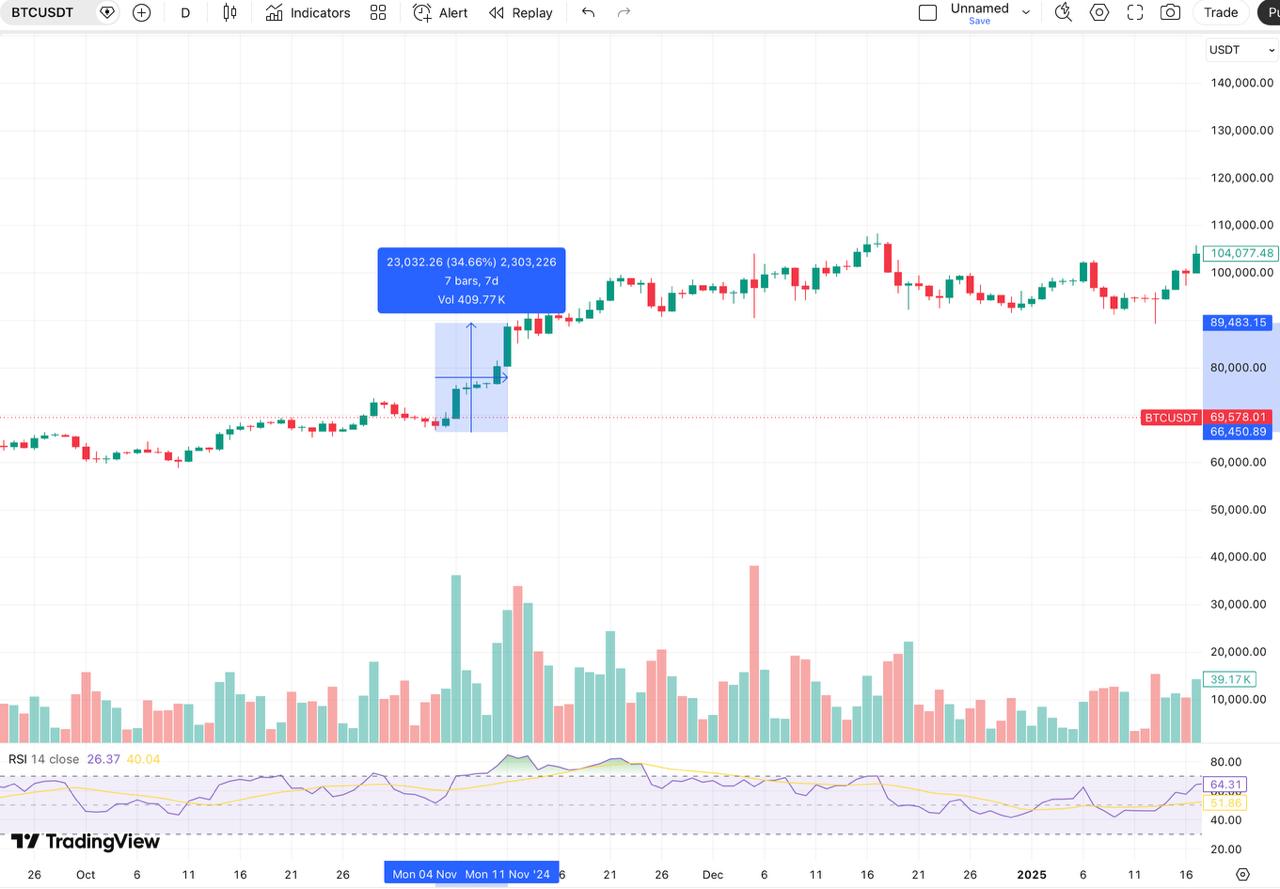
Over the full 30 days that followed, the gain reached 49.15%, approximately $32,761. The transfer landed the day after the US presidential election result, with one of the strongest macro tailwinds Bitcoin had seen in years absorbing any supply anxiety instantly.
The second was November 17-18, 2025: 10,608 BTC worth $953 million moved to an unlabeled address with a small portion routed back to the hot wallet. This time the outcome was the opposite. Over the four days following the transfer, Bitcoin dropped 15.54%, shedding approximately $14,891, according to TradingView data.
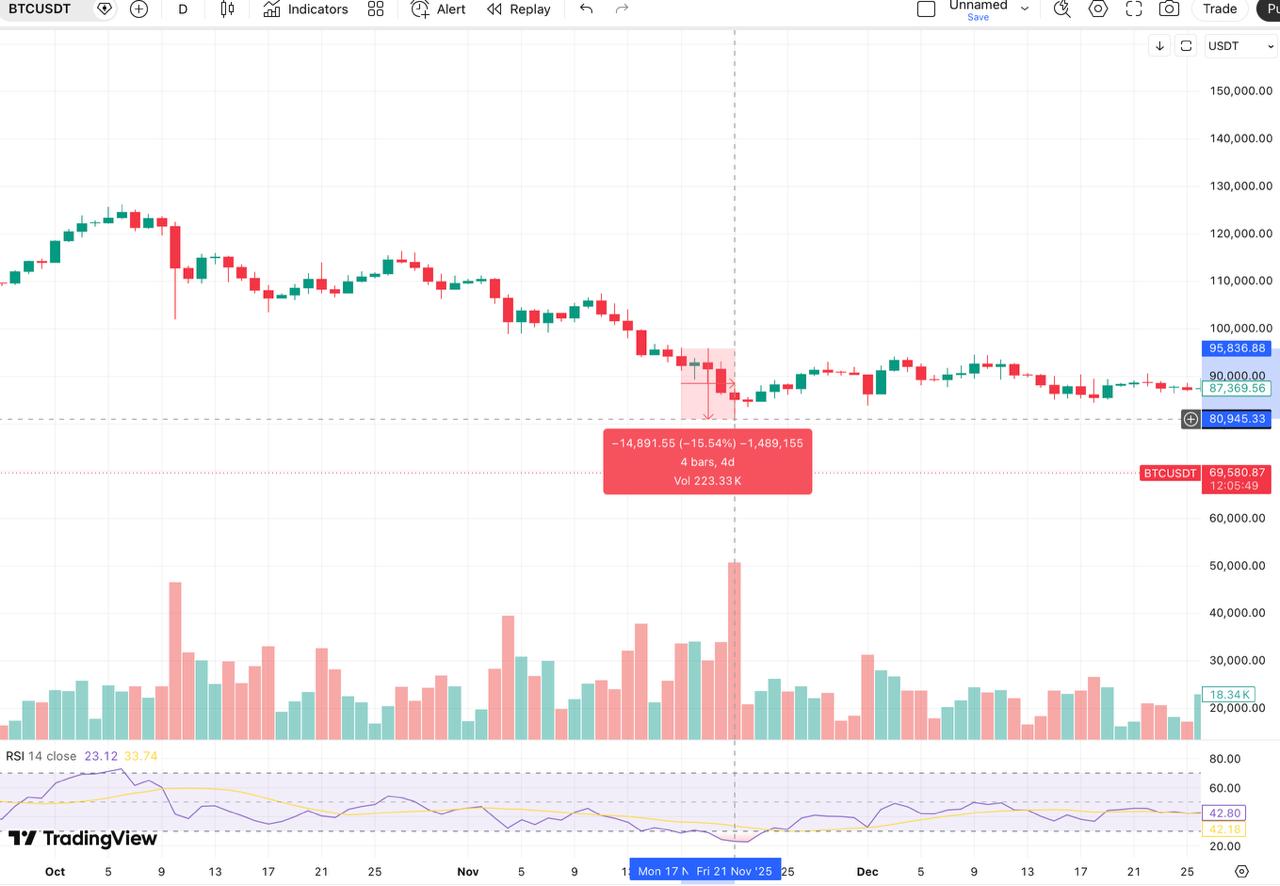
Over the following 31 days the loss extended to 11.44%, approximately $10,920. That transfer landed into a market already in a declining trend with no macro catalyst to counter the supply pressure.

Putting the two side by side makes the pattern clear. Same type of event, opposite outcomes. The difference was entirely the market environment each transfer landed in.
Which Scenario Does Today Resemble
Today’s transfer is almost identical in size to the November 2025 movement of 10,608 BTC. More importantly, the market environment it landed in has far more in common with November 2025 than November 2024.
Bitcoin is currently trading at $69,400, below the psychological $70,000 level and pressing toward the 0.618 Fibonacci support at $68,694. The past two days have already seen sustained selling pressure driven by Iran suspending US peace talks and geopolitical risk feeding into broader risk-off positioning. The Fear and Greed Index sits at 31. Institutional outflows have been running for three consecutive weeks. There is no comparable macro catalyst on the horizon that could absorb supply the way the 2024 election result did.
The November 2025 transfer landed into a weakening market and produced a 15.54% drop in four days. Today’s transfer landed into a market that was already breaking down before the Mt. Gox movement appeared on-chain.
What the $68,694 Level Means From Here
At the time of writing Bitcoin sitting at $69,400 with next support at 0.618 Fibonacci at $68,694 in immediate focus. That level is less than $700 below current price, a distance that could close in a single session if selling pressure intensifies.
The 0.618 Fibonacci has not been tested since the depths of the February 2026 crash, when the initial US-Iran war sent Bitcoin back to mid $60,000. At that time the level held and preceded the recovery that eventually carried price toward the May highs near $82,000. A retest now would arrive under meaningfully different conditions. In February the selling was sharp and fast, creating the kind of capitulation that tends to attract buyers. The current move has been slower and more sustained, with three consecutive weeks of institutional outflows suggesting a deliberate reduction in exposure rather than panic-driven liquidation.
If $68,694 holds on a closing basis, it could establish a higher-timeframe floor that gives buyers a defined level to position around. Losing it on a daily close could leave the 0.786 Fibonacci at $64,866 as the next visible reference on the chart, a level that has not been in play since early 2026.
Whether the 10,306 BTC sent to a previously unseen address represents preparation for creditor distributions or internal reorganization remains unknown. If those coins move toward exchanges in the coming days, the selling pressure on a market already sitting just above its next major support could become more difficult to absorb. If they stay dormant, the market may look past the transfer entirely.
But on the other hand with roughly 19,500 creditors already paid and the estate still holding 34,504 BTC against an October 31st deadline, the remaining distributions are not unlimited. Each transfer that clears without triggering sustained selling reduces the total overhang. Some analysts have argued that Mt. Gox supply fear has historically been worse than the actual selling, with many creditors who have waited over a decade for repayment choosing to hold rather than immediately liquidate. If that pattern holds again, the transfer could resolve as a non-event for price, similar to how the November 2024 movement was absorbed entirely by broader market momentum.
For now, Bitcoin is sitting just above the closest support with a major supply overhang newly visible on-chain and a macro environment that has not given buyers a reason to step in aggressively. The next few days may determine which of the two historical playbooks this transfer ends up following.
The information provided in this article is for educational purposes only and does not constitute financial, investment, or trading advice. Coindoo.com does not endorse or recommend any specific investment strategy or cryptocurrency. Always conduct your own research and consult with a licensed financial advisor before making any investment decisions.

Be the first to comment