


What to know:
- Aptos (APT) is consolidating after a prolonged downtrend, with price stabilizing between $0.81 and $0.88 amid low volatility.
- A breakout above $0.883 could signal a bullish reversal as Bollinger Bands tighten, indicating a potential volatility surge.
- The $4.77 macro level remains a key threshold that could determine Aptos’ long-term trend direction.

Aptos (APT) is moving in an upward consolidation with the changing conditions in the crypto market after a prolonged downtrend. According to CoinMarketCap, the APT price has surged by 1.45% over the last 24 hours, but it remains stable over the last week.
At the time of writing, APT is trading at $0.8533, with a trading volume of $58.04 million, which has declined by 2.22% over the last 24 hours. However, its market capitalization stands at $678.32 million, which is also up by 1.46%.

Source: CoinMarketCap

Also Read: Aptos Partners With Mastercard: Could It Push the ATP Toward $0.98 Target?
APT Macro Support at $4.77 Could Define Trend Shift
Furthermore, the crypto analyst CryptoGuerilla revealed that Aptos is approaching a critical macro level at $4.77, widely viewed as the 2023 structural low where most historical candle bodies previously closed.
Traders consider this zone a key equilibrium point that may determine whether price stabilizes or continues extended underperformance. Reclaiming it could signal a shift toward broader market mean reversion.
As opposed to other cryptos, Aptos stands out in its extremely poor relative performance. Aptos is currently trading well below its 2023 benchmark, whereas Sui is performing well above its respective benchmark. Avalanche, on the other hand, is trading close to its 2023 low, and Algorand is above its mark.

Source: CryptoGuerilla’s X Post
Despite the downward price pressure, the fundamentals seem solid. The on-chain volume, which includes the 24h fees, the total value locked (TVL) for RWA tokenized securities, and liquidity for stablecoins, keeps rising.
Market participants believe that some investors are unwinding their investments due to prolonged selling pressure. Still, $4.77 remains the key level defining whether Aptos re-enters peer alignment or continues isolated downside deviation.
Momentum Indicators Show Consolidative Price Movement
According to TradingView, APT shows strong downward movement that has shifted into a consolidation phase. The price, after reaching $1.10, has stabilized within the range of $0.81 to $0.88. The Bollinger Bands have started narrowing, indicating low volatility levels.
Squeezing usually takes place before an important breakout, as the current price floats around the moving average line.
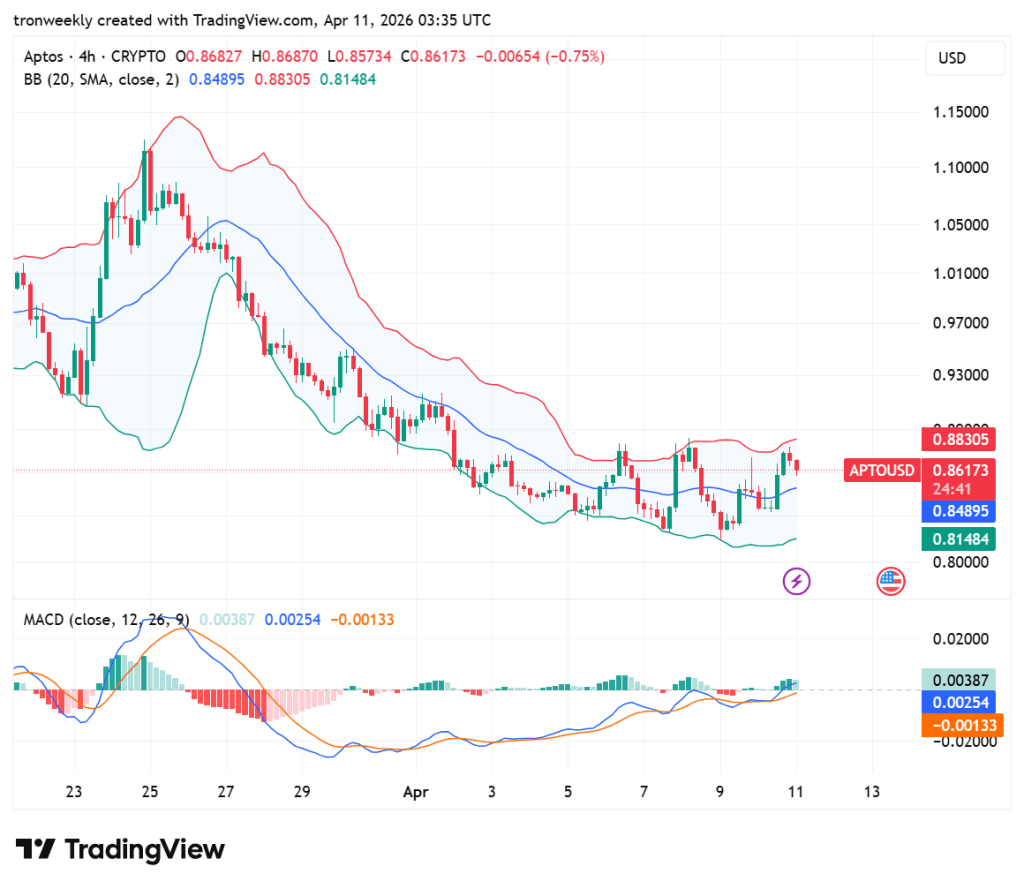
Source: TradingView
The bullish crossover in the MACD line is depicted as the blue line moves higher than the signal line. Even though there is an increase in positive momentum in the histogram, the trend is still weak around the zero level. The upper band at $0.883 needs to be breached to indicate that the reversal is valid.
This article contains market analysis and price predictions. These are not guarantees. Crypto markets are volatile. Always DYOR. Not financial advice.
Also Read: Aptos (APT) Breaks Key Resistance: Is a Bullish Rally Toward $3.90 Next?

Be the first to comment