

What to know:
- Binance Coin struggles near key $620 resistance as short-term weakness persists.
- RSI and MACD show slight relief, but no strong bullish momentum yet.
- Next moves hinge on breaking above resistance; failure may lead to further decline.

Binance Coin (BNB) is trading around an important resistance point as it tries to recover from its declining trend in the short term. However, at this moment, it is still unclear what the trend will be for the whole market. The most crucial thing now is for BNB to break through $620.
At the time of writing, BNB is trading at $602.53, with a 24-hour trading volume of $1.25 billion and a market capitalization of $82.17 billion, according to CoinMarketCap. The coin has declined 1.76% over the last 24 hours, reflecting ongoing weakness in the short term.
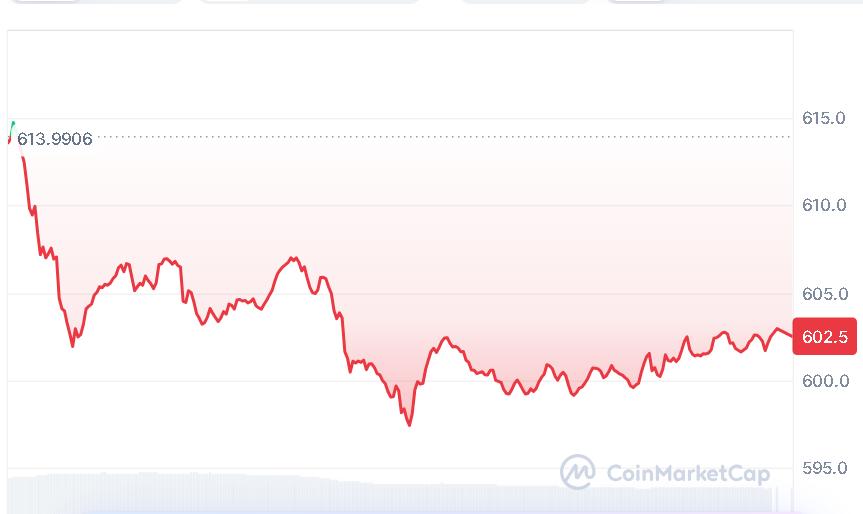
Source: CoinMarketCap

Also Read | Fartcoin Slides Toward $0.18 Following Surge in Sell-Side Volume
Binance Coin Attempts Recovery Amid Pressure
A well-known crypto market analyst, BitGuru, pointed out on April 9, 2026, that BNB has been trending down but is currently making an attempt to rebound. The cryptocurrency’s price continues to stay close to the $600 mark, which acts as an important level for the next move.
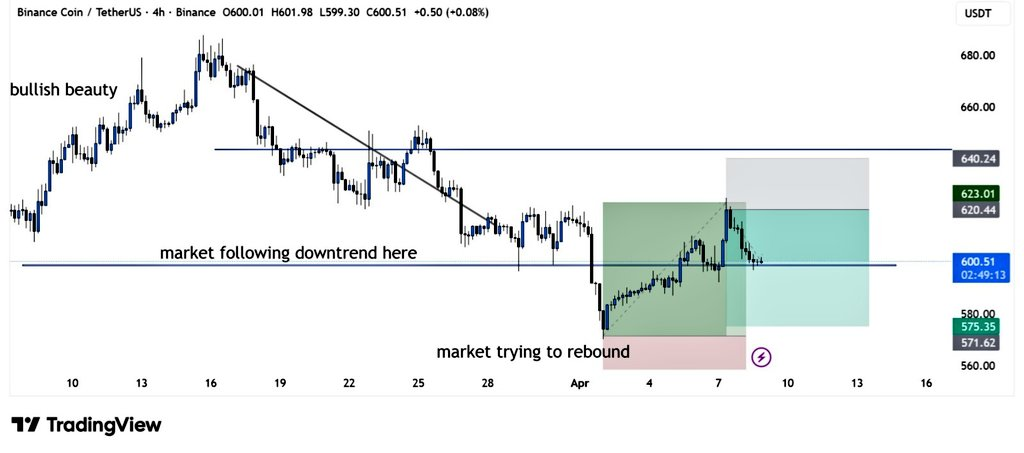
Source: BitGuru’s X Post
As pointed out by BitGuru, a decisive break above $620 would pave the way for a more aggressive rally upwards. On the other hand, failing to sustain this region could see BNB heading south again.
BNB Shows Weak Recovery Under Pressure
Though there is an attempt for a rally, BNB remains under its significant moving averages. The 20-day SMA stands close to $613, the 50-day SMA near $626, and the 100-day SMA as well as the 200-day SMA at much higher levels, namely $716 and $850, respectively.
The RSI reading now stands at 44.01, which is slightly higher than its signal line, 40.33. This indicates a modest recovery in momentum, but the readings are insufficient for an uptrend confirmation. The overall trend is weak so long as BNB trades below these key levels.
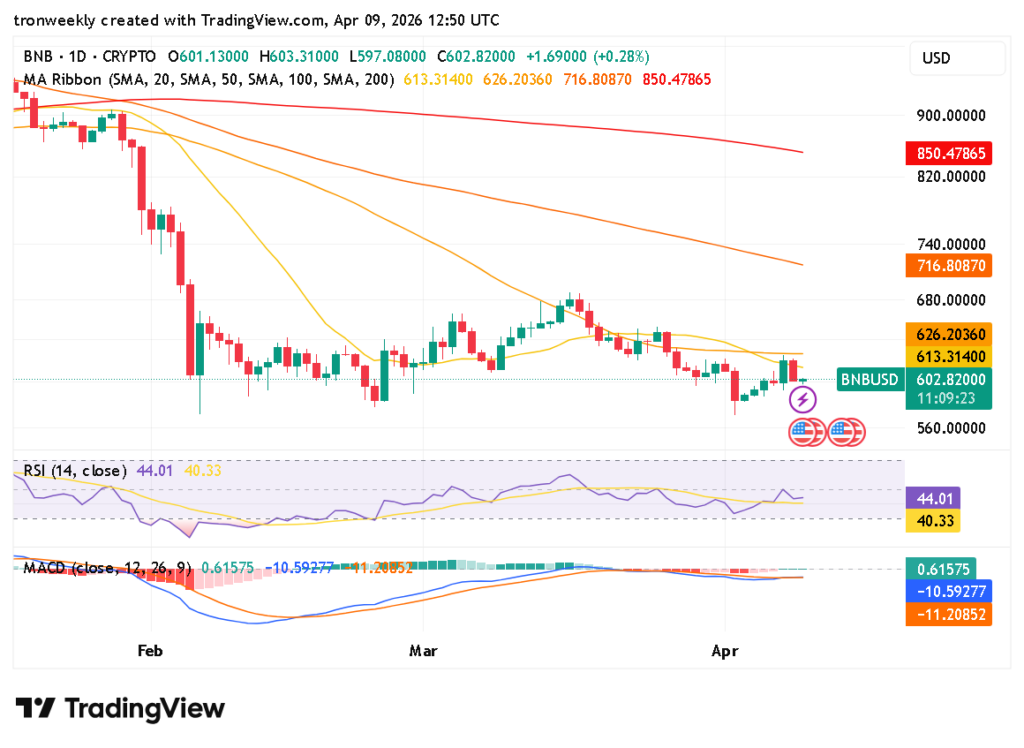
Source: TradingView
Based on the MACD, there appears to be a relief from the selling. There is now a slight positive movement in the MACD at 0.61575, even though both lines are still below zero at -10.59 and -11.20. However, there is no indication of a bullish crossover and, therefore, not enough upside momentum.
What Comes Next for BNB?
BNB finds itself in a crucial position. Its performance around the $600 to $620 area will be critical to which path it takes next. It could mean moving towards the upside for the cryptocurrency if it manages to move above resistance; otherwise, another fall is on the cards.
This article contains market analysis and price predictions. These are not guarantees. Crypto markets are volatile. Always DYOR. Not financial advice.
Also Read | Internet Computer (ICP) Eyes 300% Potential After Falling Wedge Breakout

Be the first to comment