


What to know:
- Bitcoin attempts recovery, yet significant resistance around $70,000 may prevent immediate bullish breakout momentum.
- Technical indicators show a modest upward trend, but overall market strength is not fully convincing yet.
- Historical cycles indicate the possibility of a market low forming towards the end of the year.

Bitcoin appears to be in a recovery phase, even though it continues to face resistance at around $70,000. Based on trends in the past, there may be a chance that Bitcoin could reach a market bottom towards the end of the year.
At the time of writing, Bitcoin (BTC) is trading at $70,003, with a 24-hour trading volume of $49.31 billion and a market capitalization of $1.39 trillion. Over the last 24 hours, BTC has gained 3.94%, reflecting renewed buying interest following its consolidation phase.
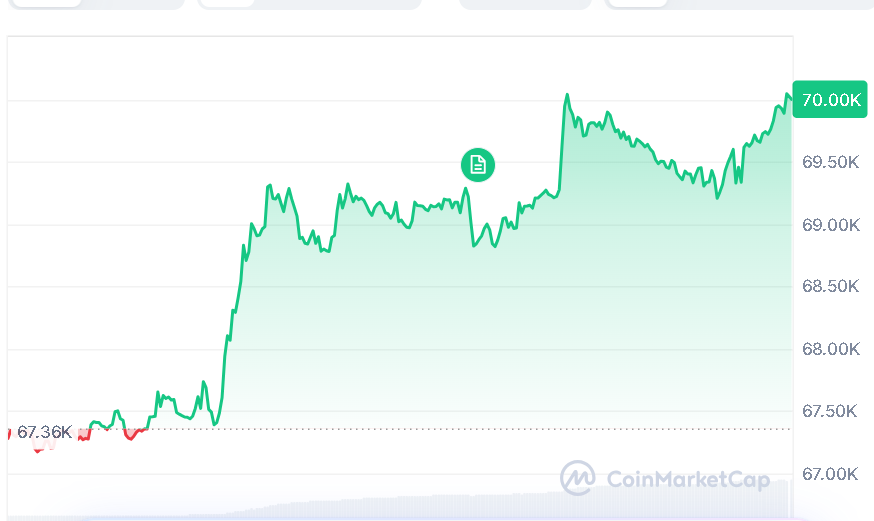
Source: CoinMarketCap

Also Read | Ondo Finance Surpasses $3.5B TVL: ONDO Could Pass $0.28 to Gain Momentum?
Bitcoin Mirrors 2024 Halving Levels
On April 6, 2026, Crypto analyst More Crypto Online noted that Bitcoin is hovering around the same price level reached during the 2024 halving. Historical cycles show that each phase tends to yield slower gains, and BTC’s current performance largely follows this pattern.
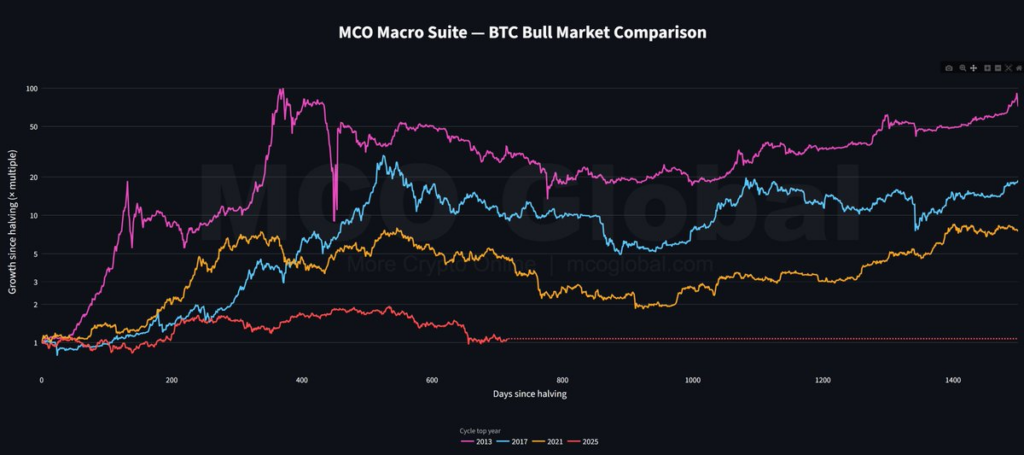
Source: More Crypto Online’s X Post
In this regard, the market structure remains open to a possible low in the coming months. Should history repeat itself, a low could be witnessed during the fourth quarter of the year; however, this does not provide an exact prediction but rather an observation drawn from past experiences.
Bitcoin Faces Key Resistance
The Bitcoin currency stands at around $69,622, and its RSI score shows 52.86, depicting a somewhat rising trend. The support area is seen between $68,576 and $68,652, offering some cushion in case of any price drop.
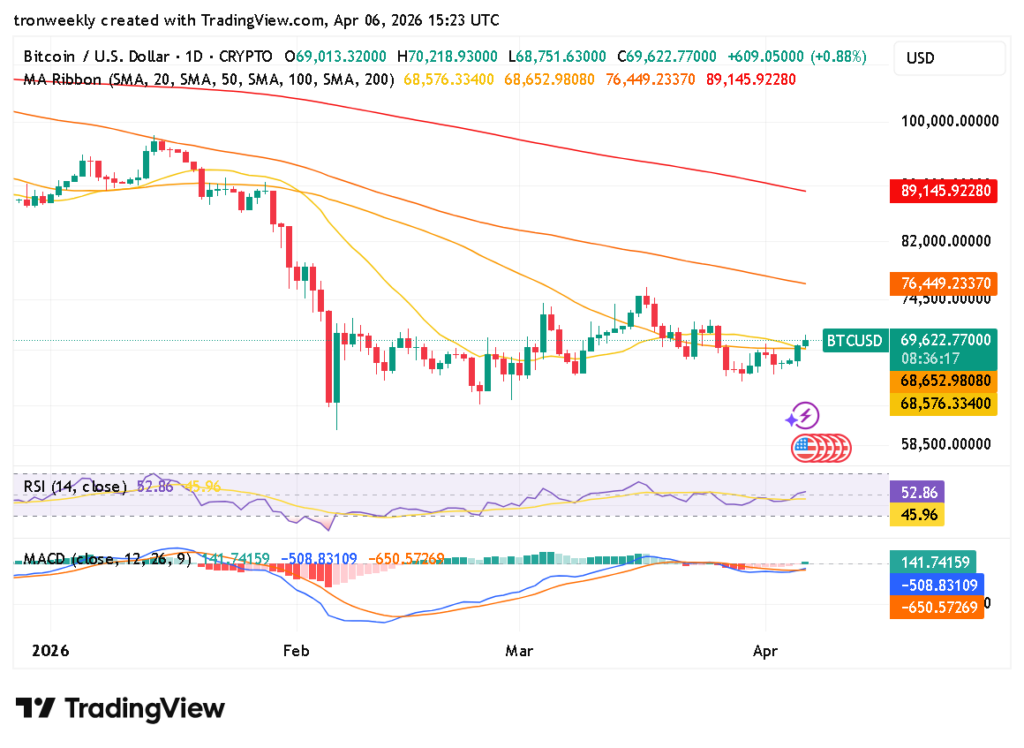
Source: TradingView
In contrast, the more prolonged moving averages of $76,449 and $89,145 are quite high from the present price level, thus showing that the trend is still encountering considerable resistance.
The MACD has just started turning to the positive side but is still below its signal line, as indicated by the MACD line at 141.74 compared with the signal line at -508.83. The histogram of MACD at -650.57 has also improved.
Bitcoin Struggles to Break Resistance
Overall, Bitcoin’s momentum is trying to rebound, but has not yet reached a level that is powerful enough to break out. Investors are waiting to see if BTC will manage to conquer its crucial resistance levels or stick to its previous course towards a possible yearly end low.
This article contains market analysis and price predictions. These are not guarantees. Crypto markets are volatile. Always DYOR. Not financial advice.
Also Read | Bitcoin Price Stuck in 69-Day Range: Is $75K Break Next?

Be the first to comment