


What to know:
- Bitcoin surged above $73,000, gaining nearly 10% over the past week amid strong bullish momentum.
- US CPI eased to 3.3%, boosting risk sentiment and increasing investor appetite for crypto and other risk assets.
- Bitcoin confirmed a bullish inverse head and shoulders breakout, signaling continued upside rally toward $80,000.

Bitcoin is moving in a strong positive price trajectory following the CPI drop and the ceasefire in the Iran-Israel War. According to CoinMarketCap, the BTC price has surged by 1.16% over the last 24 hours and 9.28% over the last week.
At the time of writing, BTC is trading at $73,109.31, with a trading volume of $39.12 billion, which has surged by 6.77% over the last 24 hours. However, its market capitalization stands at $1.46 trillion, which is also up by 1.23%.

Source: CoinMarketCap

Also Read: BlackRock Bitcoin ETF Sees Record Inflows in 2026
Bitcoin Surges After CPI Drop, Eyes $80K Target
However, the crypto analyst Trader Tardigrade highlighted that US CPI data eased to 3.3%, coming in below expectations and signaling cooling inflation in the US economy.
This softer reading has improved risk sentiment across global markets, as investors reassess the likelihood of prolonged monetary tightening. Crypto and equities reacted positively, with liquidity-sensitive assets beginning to price in a more supportive macro environment.
At the same time, Bitcoin validated its bullish inverse head-and-shoulders breakout early ahead of schedule, reinforcing the technical setup.
As a result, the breakout will likely bring about more buyers for Bitcoin, with traders now looking at the $80,000 resistance level to follow. Although there’s still plenty of volatility, both the macro environment and the technicals are aligned for an uptrend.
BTC Technical Outlook Reveals Strong Bullish Reversal
According to TradingView, Bitcoin shows signs of a strong bounce following its stabilization at $65,000. Its present value floats at $73,034 while trending positively beyond the moving averages.
The 20-period simple moving average, with a value of $71,630, represents dynamic support, indicating a reversal pattern that has seen the different moving averages fanning out in an upward direction.
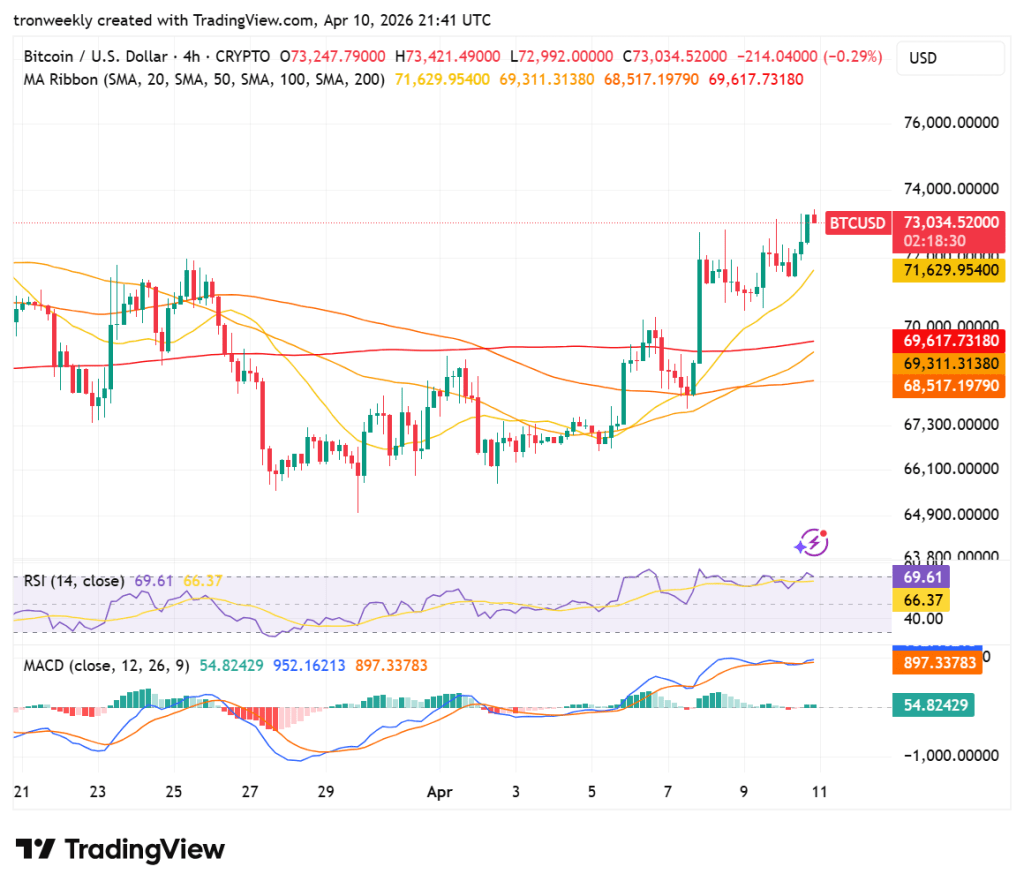
Source: TradingView
Technicals indicate strong momentum heading into overbought levels. The RSI sits at 69.61, indicating strong buying sentiment that may soon need to consolidate.
Meanwhile, the MACD indicator shows a positive crossover, with consistent green histogram bars. Although the trend is bullish, the small flattening in the MACD indicates that the first wave of fast momentum is stabilizing.
This article contains market analysis and price predictions. These are not guarantees. Crypto markets are volatile. Always DYOR. Not financial advice.
Also Read: Bitcoin Whale Inflows Drop Below $3B First Time Since 2025

Be the first to comment