


What to know:
- Bitcoin derivatives exposure reaches record levels ahead of March 27 expiry.
- BTC dominance tests historic resistance zone linked to past altcoin rallies.
- Market positioning suggests a decisive shift may follow in the coming days.


The crypto market enters a critical phase as large-scale positioning builds across both derivatives and spot indicators, pointing to a potential turning point for Bitcoin and the broader altcoin space.
Analyst Crypto Tice reported on March 21 that Bitcoin options open interest has climbed to an all-time high. This signals that more capital is now locked into derivative contracts than at any other point in the asset’s history. The timing is notable, as the market approaches its largest quarterly expiry scheduled for March 27.

High open interest indicates that large institutions and large traders are heavily involved. They tend to use options to hedge their risks and bet on volatility. This is not a passive position.

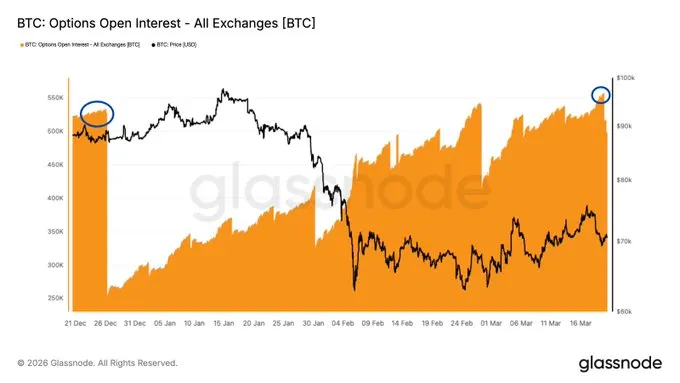
Source: X
There are many bets on each side, and the final unwind will cause a large price move. In the past, large expiry dates have meant quick movements as the contracts are settled and the money changes hands.
This time around, the size of the positions could mean the outcome is more important than usual. The run-up to expiry could be quiet, but things are building as everyone prepares for the final outcome.
Also Read: Binance Expands SAFU Fund With 1,315 BTC While Bitcoin Targets $84K
Bitcoin Dominance Faces Key Rejection Zone
Meanwhile, analyst Crypto Patel has pointed out the major shift in the dominance of Bitcoin. Its dominance is now between 58% and 64% on the monthly chart, and we have seen this act as a resistance in the past.
However, if we look at data from previous years, we can see a pattern. For example, Bitcoin Dominance levels were at a similar peak in 2018 and 2021, dropping significantly from these levels.
This signaled a strong altcoin run, with money moving from Bitcoin to altcoins. The current levels are similar to these previous levels and are a historically sensitive area.


Source: X
The chart indicates a long-term uptrend that began after dominance started to fall to levels of 35% to 40%. In the last few years, Bitcoin slowly gained more and more share of the market due to careful investment and a tendency to invest in well-known assets during uncertain times.
Signs Point to Potential Altcoin Rotation
The recent price movements indicate that the dominance of Bitcoin is losing steam, especially around the resistance area. The presence of a clear “rejection wick” on the monthly chart indicates that there was selling at higher levels.
If dominance is unable to break above this zone and instead goes below its uptrend line, it could be a possible change in its structure.
A situation like this is likely to cause money to flow to altcoins, repeating the same situation as in the past years. Bitcoin may remain dominant, but other coins may start to do better.
However, the above idea is dependent on some conditions. If the market is above the 70% level, then the idea of the bearish view on dominance would be false, and Bitcoin would remain concentrated.
This article contains market analysis and price predictions. These are not guarantees. Crypto markets are volatile. Always DYOR. Not financial advice.
Also Read: Ethereum Drops 10% as Bitcoin Weakness Pushes ETH Toward $2,120 Support
Be the first to comment