


What to know:
- BCH holds $400–$420 support with the trendline intact as analysts flag a key decision point.
- A break above support may push BCH toward $600, while failure risks dropping to the $300 zone.
- Price stays below EMAs; RSI at 35 signals weak momentum with no reversal yet.

Bitcoin Cash (BCH) hovered near a decisive level as sellers maintained control in recent sessions. Price action remained compressed within a tight range. Market participants continued to watch for a clear directional move from this zone.
According to CoinMarketCap data, Bitcoin Cash (BCH) is trading at $422.90, showing a decline of 3.63% in the past 24 hours. The trading volume is currently standing at $233.51 million, up 43.93%. The token has gone up slightly by 0.28%.
Also Read: Bitcoin Cash (BCH) Ascending Triangle Signals Breakout to $660–$1,800

BCH Holds Support as Higher Low Forms
Crypto analyst Marcus Corvinus highlighted that BCH is sitting at a key weekly support range between $400 and $420. He noted that the price is holding an ascending trendline. This area acts as a major decision point.
According to analysts, the pattern stays clear for now. The higher low formation at the support region implies that the bullish trend is strong. If this level doesn’t fall back, then the move to higher levels like $600 and even above is likely.
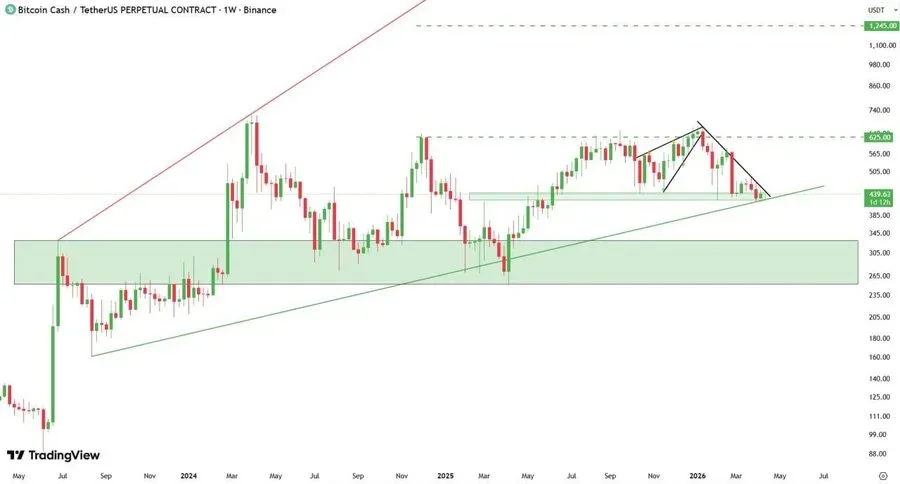

He also warned of downside risk. If there is failure at the support level, the pattern will reverse instantly. In this case, the price will head lower into the $300 demand region.
Additionally, another analyst, Crypto Woodyz, shared a different insight. He mentioned that BCH is forming a higher low near weekly support in the $420 region while staying above the rising trend line.
Holding this region could see a bounce towards $600 and above. Failure of this level could see the price head further down into the $300 region.
EMAs Act as Resistance as RSI Signals Weakness
From a technical perspective, there is persistent pressure on the price. The price of BCH is below all major EMAs. The 20-day EMA is at $447.5, while the 50-day EMA is at $468.6.
These EMAs are significantly above the current price levels and thus serve as resistance areas. Their negative slope indicates low momentum.
The more long-term downtrend continues to put pressure on the prices. The 100-day EMA is at $495.7, while the 200-day EMA is at $511.4.
These figures are much higher than the current price levels. It clearly demonstrates the power of this trend. It will take a significant rise to overcome these levels.
The Relative Strength Index (RSI) is at 35.87, and the RSI’s moving average is at 41.79. Both values are below the 50 threshold. It means that there is negative momentum in the market. The RSI is nearing oversold territory but has not shown a reversal signal.
This article contains market analysis and price predictions. These are not guarantees. Crypto markets are volatile. Always DYOR. Not financial advice.
Also Read: Toncoin (TON) Falling Wedge Breakout Sparks a 100% Rally Toward $3

Be the first to comment