


What to know:
- Bitcoin faces short-term selling pressure, with potential for a deeper correction before resuming its long-term uptrend.
- Technical indicators show weakness: RSI near 34.85, trading below major moving averages, and MACD below its signal line.
- Long-term outlook remains bullish, with potential targets of $150,000, $250,000, and ultimately $350,000.


Bitcoin is under selling pressure as its momentum is losing steam, and there is a possibility of a deeper correction, according to a crypto analyst, Crypto Patel. Even though there is some uncertainty, Bitcoin could eventually touch its long-term cycle high of $350,000, Patel stated.
At the time of writing, BTC is trading at $70,597, increasing by 1.33% over the last 24 hours with a trading volume of $49.95 billion, according to CoinMarketCap. While the BTC price seems stable, technical indicators are indicating continued pressure for the market.


Source: CoinMarketCap
Bitcoin Faces Correction Amid Selling Pressure
Crypto analyst Crypto Patel shared his insights on the outlook of BTC in a post on March 20, 2026. According to Crypto Patel, although the future outlook of Bitcoin seems promising, there could be a major pullback before the uptrend commences. This can be seen in the past trends of Bitcoin.

Source: Crypto Patel’s X Post
From a technical point of view, the price of Bitcoin has recently fallen below a significant long-term ascending trendline. It is noteworthy that the price has been following this trendline since 2023. Moreover, the price zone of $90,000 to $98,000 has been identified as the resistance zone where the price may face increased selling pressures.
Bitcoin Builds Long-Term Recovery Momentum
Crypto Patel pointed out several key areas of accumulation that may be relevant during the correction phase. The first area is around $56,611, which is the 0.382 Fibonacci retracement.
The next deeper support level is around $44,193, which represents mid-cycle consolidation. However, the strongest accumulation region exists around $34,499, which corresponds to the 0.618 Fibonacci retracement and is often referred to as the “golden pocket.”
Looking forward, the long-term outlook is very optimistic. From the historical cycles and structure, the analyst is projecting targets such as $150,000 and $250,000, before eventually peaking at $350,000. Please note that these targets are purely speculative and based on market reactions to corrections.
Also Read | Bitcoin (BTC), Ethereum (ETH) Face $58M Whale Short as Trader Nets $1.15M Profit
Technical Indicators Signal Bitcoin Pressure
Technical indicators indicate a short-term weakness. The RSI is at 34.85, close to oversold but not yet showing strong buying power. Bitcoin is still trading below major moving averages at $82,635, $87,451, and $98,402. The 200-day MA is trading around $59,078 and is still below the current price.
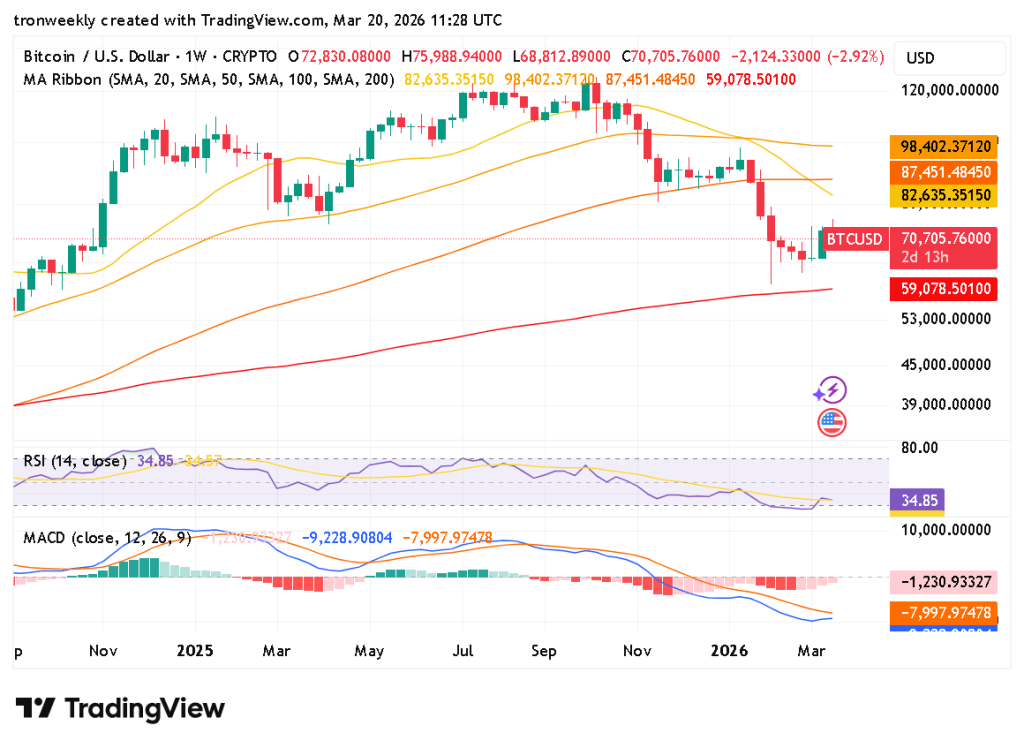
Source: TradingView
The MACD line remains below the signal line, indicating continued selling pressures, although at a slower rate, which may indicate stabilization.
Overall, Bitcoin is at a critical juncture where short-term downside risks and long-term bullish potentials meet. While further downside risks are not out of the question, analysts believe that any further downside may actually lay the groundwork for the next big move higher for the crypto space.
This article contains market analysis and price predictions. These are not guarantees. Crypto markets are volatile. Always DYOR. Not financial advice.
Also Read | Binance Coin (BNB) Slips to $640 as Selling Pressure Mounts

Be the first to comment