


What to know:
- Bitcoin struggles to break above the $69,000–$70,000 resistance, signaling persistent selling pressure.
- Trading below all major moving averages confirms the ongoing downtrend and weak market momentum.
- Technical indicators like RSI at 42.95 and negative MACD suggest buyers remain subdued.

Bitcoin continues to show signs of weakness on April 3, 2026, failing to make any positive moves following its previous high. From a technical standpoint, there is evidence that the sellers have maintained their upper hand, and any positive move from Bitcoin may yet prove difficult.
At the time of writing, Bitcoin (BTC) is trading at $66,896, with a 24-hour trading volume of $31.30 billion and a market capitalization of $1.34 trillion, according to CoinMarketCap. Over the last 24 hours, BTC has gained 0.33%, yet its recent price movement shows signs of slowing momentum.
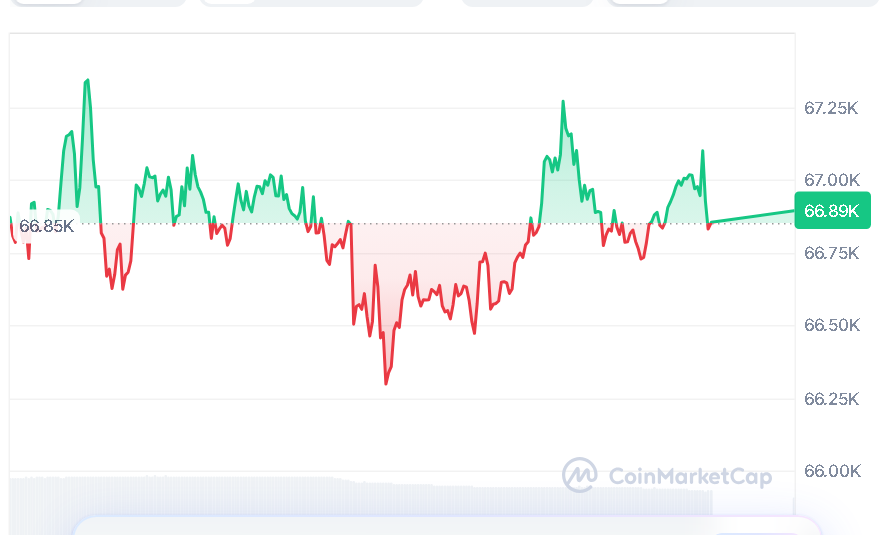
Source: CoinMarketCap

Also Read | Bitcoin Slides as Bloomberg Strategist Warns of Potential Drop to $10,000
Bitcoin Struggles as Bears Dominate
On April 3, 2026, a well-known crypto analyst, Ted, pointed out that BTC is yet to exhibit strength. The BTC hit an all-time high around $76,000 just last month; however, it is trading at a pattern of higher highs and lower lows.
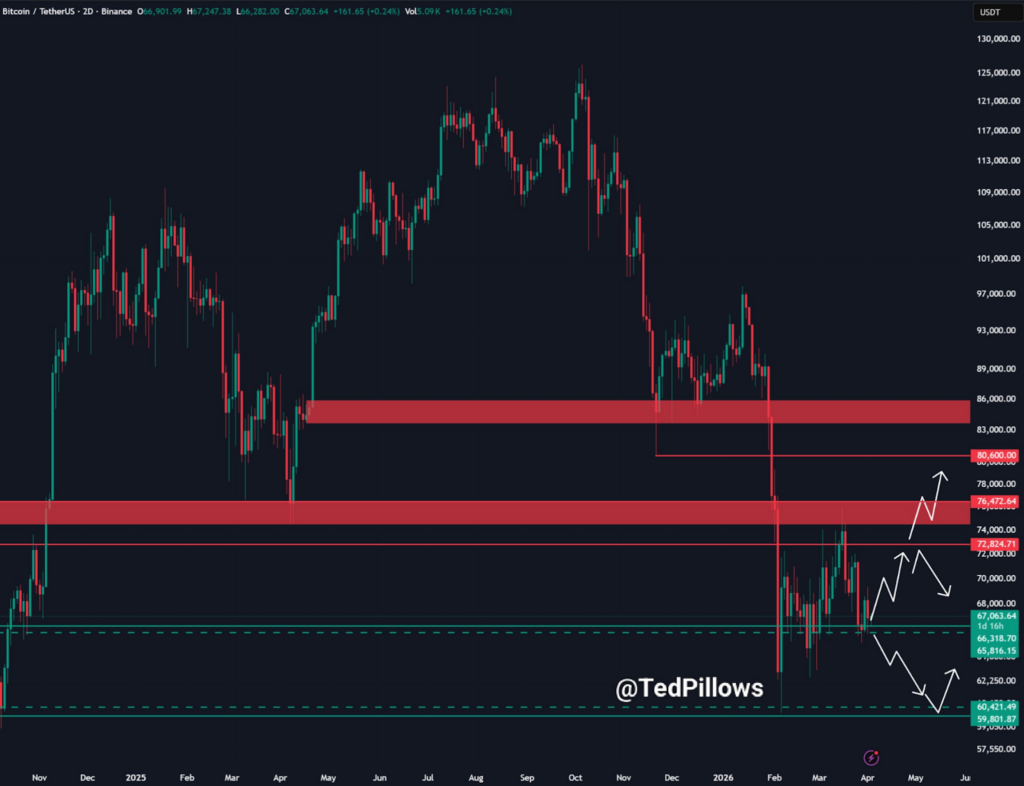
Source: Ted’s X Post
Analyst Ted emphasized that the level between $69,000 to $70,000 is considered a critical level. This range consists of short positions, and BTC could visit this level again before any selling pressure appears.
Bitcoin Shows Signs of Weakness Persisting
Bitcoin continues to trade below all its moving averages. This is based on the fact that the 20-day simple moving average stands at $69,345, while the 50-day simple moving average is at $68,675. At the same time, the 100-day simple moving average is at $77,009, and the 200-day SMA at $89,866, confirming the broader downtrend.
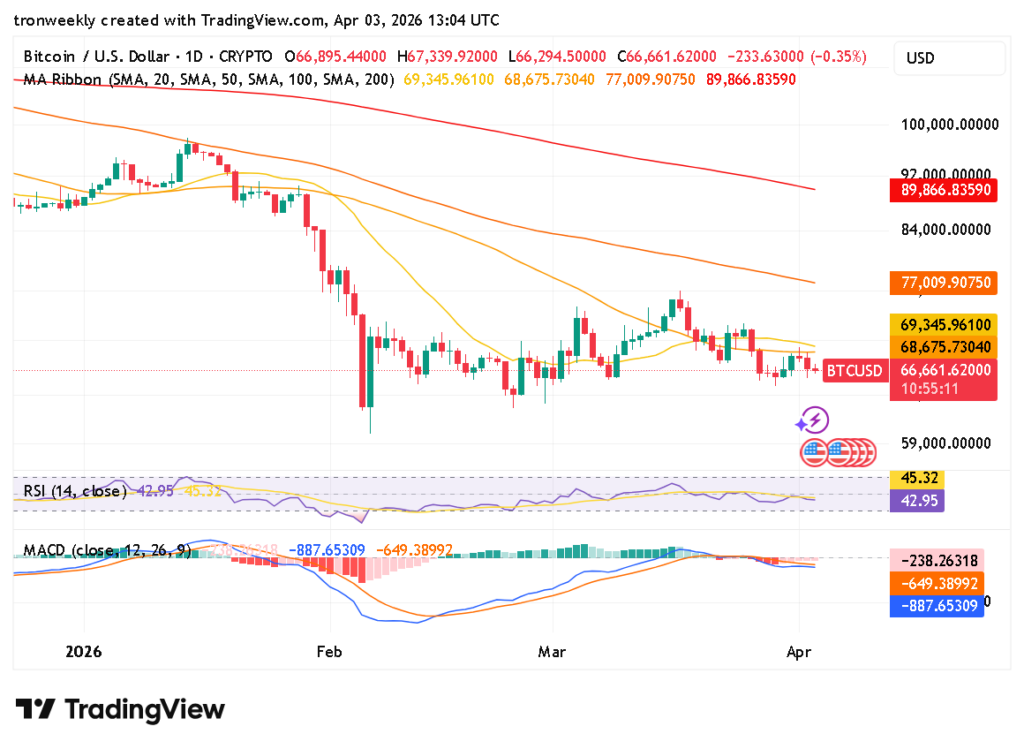
Source: TradingView
The RSI stands at 42.95, lower than the signal line of 45.37, which suggests that the buying interest is weak. On the other hand, the MACD demonstrates negative momentum, as the MACD line is positioned at -887.65, lower than the signal line of -649.38, and a negative histogram of -238.26. It implies that the sellers have maintained dominance, and there is no sign of reversal yet.
Overall, Bitcoin remains under pressure despite some positive developments, and market players will monitor the level at $69,000–$70,000 for signs of further action.
This article contains market analysis and price predictions. These are not guarantees. Crypto markets are volatile. Always DYOR. Not financial advice.
Also Read | Cardano Executive Signals Powerful 2026 Mastercard Breakthrough Moves

Be the first to comment