


What to know:
- Bitcoin is trading near key support as short-term weakness raises caution among investors.
- Analyst Ali Martinez signals shift to long-term holders, hinting at early accumulation phase.
- Price remains below key moving averages with RSI under 50, confirming bearish short-term momentum.


Bitcoin is showing signs of weakness in the short term as major levels of support are closely monitored by investors in the market. According to an analyst, Ali Martinez, weaker holders of bitcoin have left the market, and stronger investors remain in control. This might mean that a new phase of accumulation is beginning before the next bull run.
At the time of writing, Bitcoin (BTC) is trading at $68,420, with a 24-hour trading volume of $34.66 billion and a total market capitalization of $1.37 trillion, according to CoinMarketCap. The BTC has fallen by 3.20% over the last 24 hours.


Source: CoinMarketCap
Bitcoin Near Support Signals Accumulation
Crypto analyst Ali Martinez noted in his X post on March 26, 2026, that Bitcoin traditionally launches new bull markets after touching major support levels.
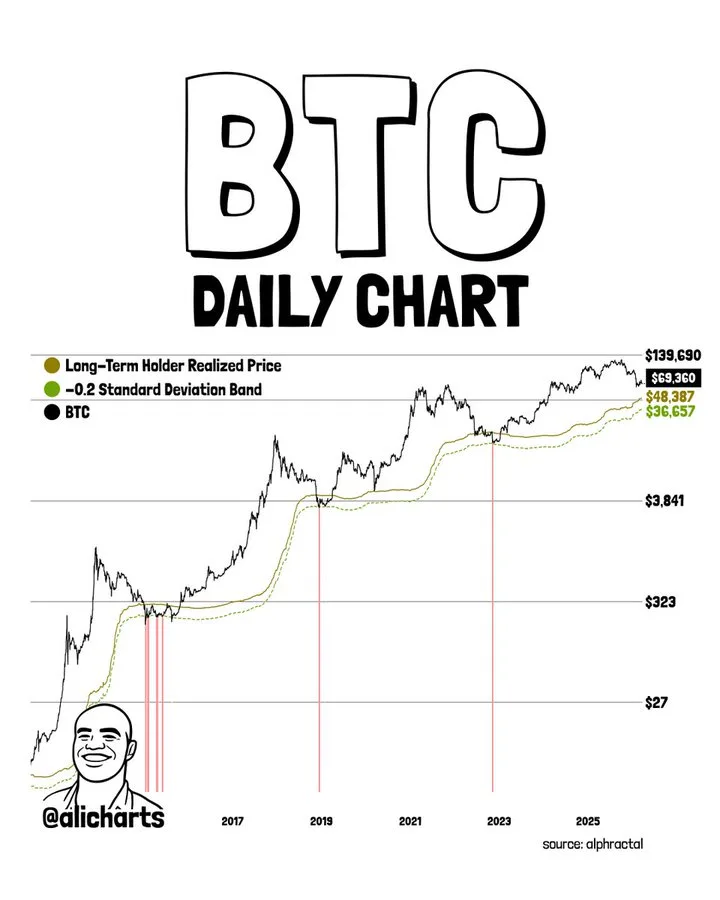

Source: Ali Martinez’s X Post
Major levels of interest include long-term holders realized price levels of $48,387 and -0.2 standard deviation levels of $36,657. These levels might offer dip-buying opportunities before the next bull run.
Moreover, Martinez also emphasized that weaker holders have left the market. The Realized Cap for new Bitcoin holders is low, indicating that speculative activity in the market has subsided. This is a stage where long-term holders or committed holders dominate the market, paving the way for accumulation and the start of a new bull run.
Bitcoin Weakens Below Key Averages
On the technical front, Bitcoin is trading below its major short-term averages. The Relative Strength Index (RSI) is recorded as 45.28, which is below 50.
The price is trading below its 20-MA ($70,291) and its 50-MA ($68,862), indicating resistance levels. We can also notice that the price is trading below its long-term MA levels of 100-MA ($78,658) and 200-MA ($91,768).
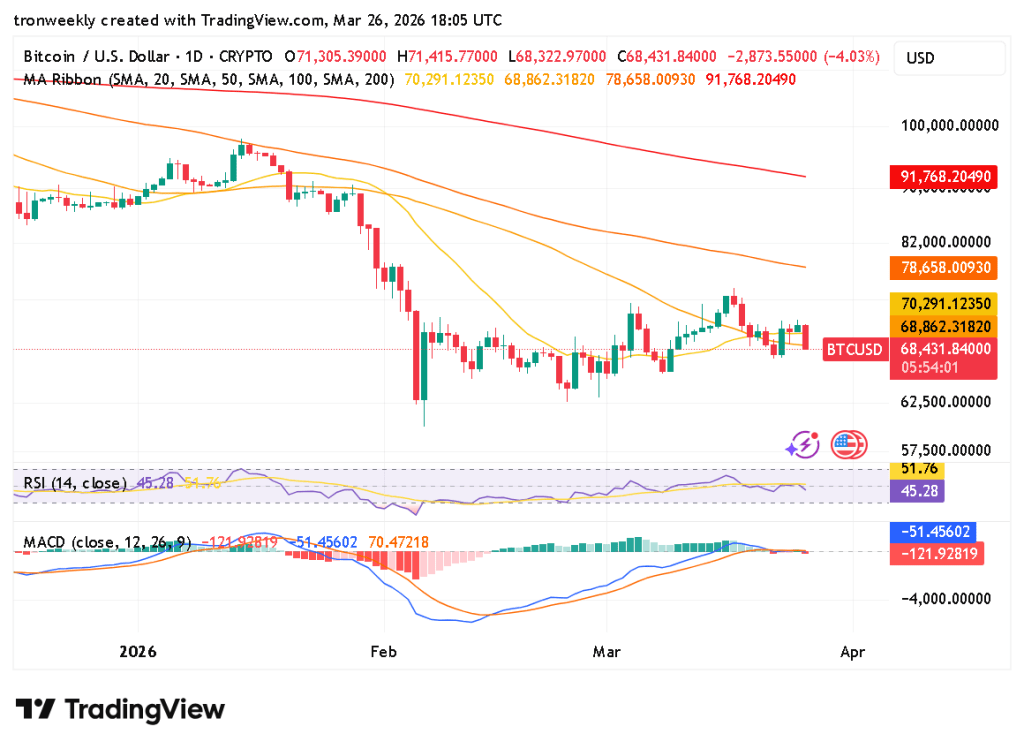
Source: TradingView
The MACD line currently sits at -51.45, slightly above the signal line at -121.92, with the histogram showing a positive figure of 70.47. Although this may be a recovery attempt, the decreasing histogram bars may not sustain this bullish run unless more buying pressure comes into the market.
Also Read | Coinbase Survey Shows 25% Institutions Plan XRP Allocation in 2026
What Investors Should Watch
Bitcoin is currently in its consolidation phase, and there is intense focus on its critical supports. The exit of speculators and the entry of longer-term holders suggest that Bitcoin is entering its phase of strategic accumulation.
This suggests that Bitcoin is on its way to its next upward movement and could present opportunities for entry for investors ahead of its next bull run.
This article contains market analysis and price predictions. These are not guarantees. Crypto markets are volatile. Always DYOR. Not financial advice.
Also Read | XAUT Surges: 2026 Gold Meets Crypto Power on Binance

Be the first to comment