


What to know:
- Analysts warn Bitcoin’s four-year cycle pattern points to a potential bottom in Q4 2026, not now.
- A key indicator that flashed red before past bear markets just flipped again on the weekly chart.
- Long-term holders are still selling at a loss, a trend that historically precedes final market bottoms.


Bitcoin may not have reached its cycle bottom, according to analysts tracking on-chain and technical indicators. On March 20th, 2026, analyst ChartNerd stated that Bitcoin has historically operated under an approximate four-year cycle.
Recent data suggests the current price structure may represent a temporary relief rally rather than a confirmed reversal. Based on the four-year cycle pattern, ChartNerd stated that the top of this cycle likely occurred in Q4 2025.

Therefore, the cycle bottom should occur in Q4 2026. As of today, March 20th, 2026, Bitcoin’s price is around $69,516, as shown by CoinMarketCap.
Patterns Indicate More Downward Movement
ChartNerd indicated that the previous Bitcoin cycles followed similar timing patterns throughout all types of market events. The cycle tops previously identified occurred at least a couple of months prior to the next cycle downtrend.
These downtrends last approximately one year until a new cycle bottom is established. This same type of pattern also emerged just before the cycle bottoms of 2018 and 2022, which further supports the current structural analysis.
If the same type of pattern develops again, the current BTC price will likely be part of a short-term relief rally within the larger overall downtrend. The analyst described $60,000 as a possible zone for a short-term relief rally.
Based on his analysis, there is still the possibility of additional downside in the remainder of 2026 before a complete cycle bottom formation.
Also Read | Bitcoin Tests Long-Term Support as Critical Level Hints at Market Reversal
Key Trend Indicator Turns Red Again
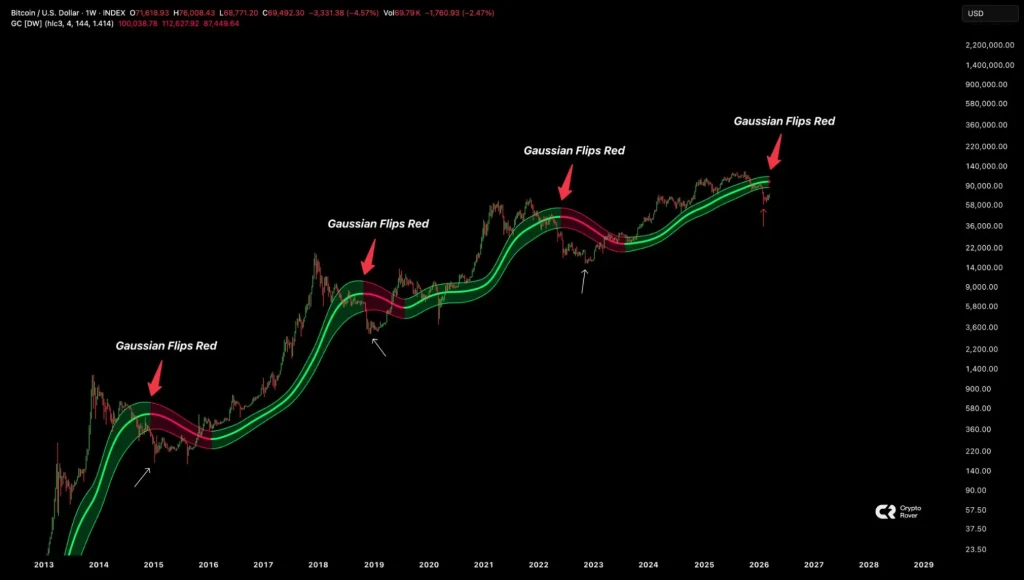
Meanwhile, Crypto Rover referenced the Gaussian Channel as a well-established trend indicator. As per Crypto Rover, every Bitcoin cycle bottom has formed subsequent to the Gaussian Channel turning red.
The pattern was visible during each of the three most recent bear markets in 2015, 2018, and 2022. Most recently, the Gaussian Channel has turned red again on the weekly time frame, sparking attention among analysts.
Crypto Rover indicated that this signal suggests that the last cycle bottom has not been reached for Bitcoin.
Long-Term Holder SOPR Remains Below 1
Additionally, on-chain data continues to support a cautious viewpoint in regards to LTH SOPR. Despite a slight increase in the LTH SOPR recently, CryptoQuant data shows it has remained below 1.
After several days of decreases in the long-term holder activity, the LTH SOPR increased from 0.750 to 0.792. However, the seven-day moving average for LTH SOPR is still under the critical 1.0 level, which is necessary for long-term sustained recovery.
This confirms that the average long-term holder continues to sell at a loss. Additionally, historical data shows that these prolonged periods when this metric is below 1 often precede the ultimate market cycle bottoms.
A Lack of Confidence Among Traders
Derivatives data provide evidence of a lack of confidence among leveraged traders in the Bitcoin futures market. According to data from CoinGlass, the Bitcoin funding rate has remained in the neutral to slightly negative territory in recent days.
Furthermore, open interest in the Bitcoin futures market has decreased slightly, which implies that fewer leveraged traders are participating. As has been observed previously, low funding and declining open interest have been associated with additional downward pressure or continued price consolidation.
Based on the above, it appears that the current price movement may only be a short-term relief rally, rather than a confirmed reversal.
This article contains market analysis and price predictions. These are not guarantees. Crypto markets are volatile. Always DYOR. Not financial advice.
Also Read | Bitcoin Correction Tests Support While Poised for Long-Term Rally Toward $350000

Be the first to comment