

The beginning of this week has been a busy one for the $BTC price. From making a new low at just under $58K, the price then rallied 6% but has since come back to potentially confirm $60K as support again. Bounce or failed rally from here?
$60K holding as support – falling wedge developing?
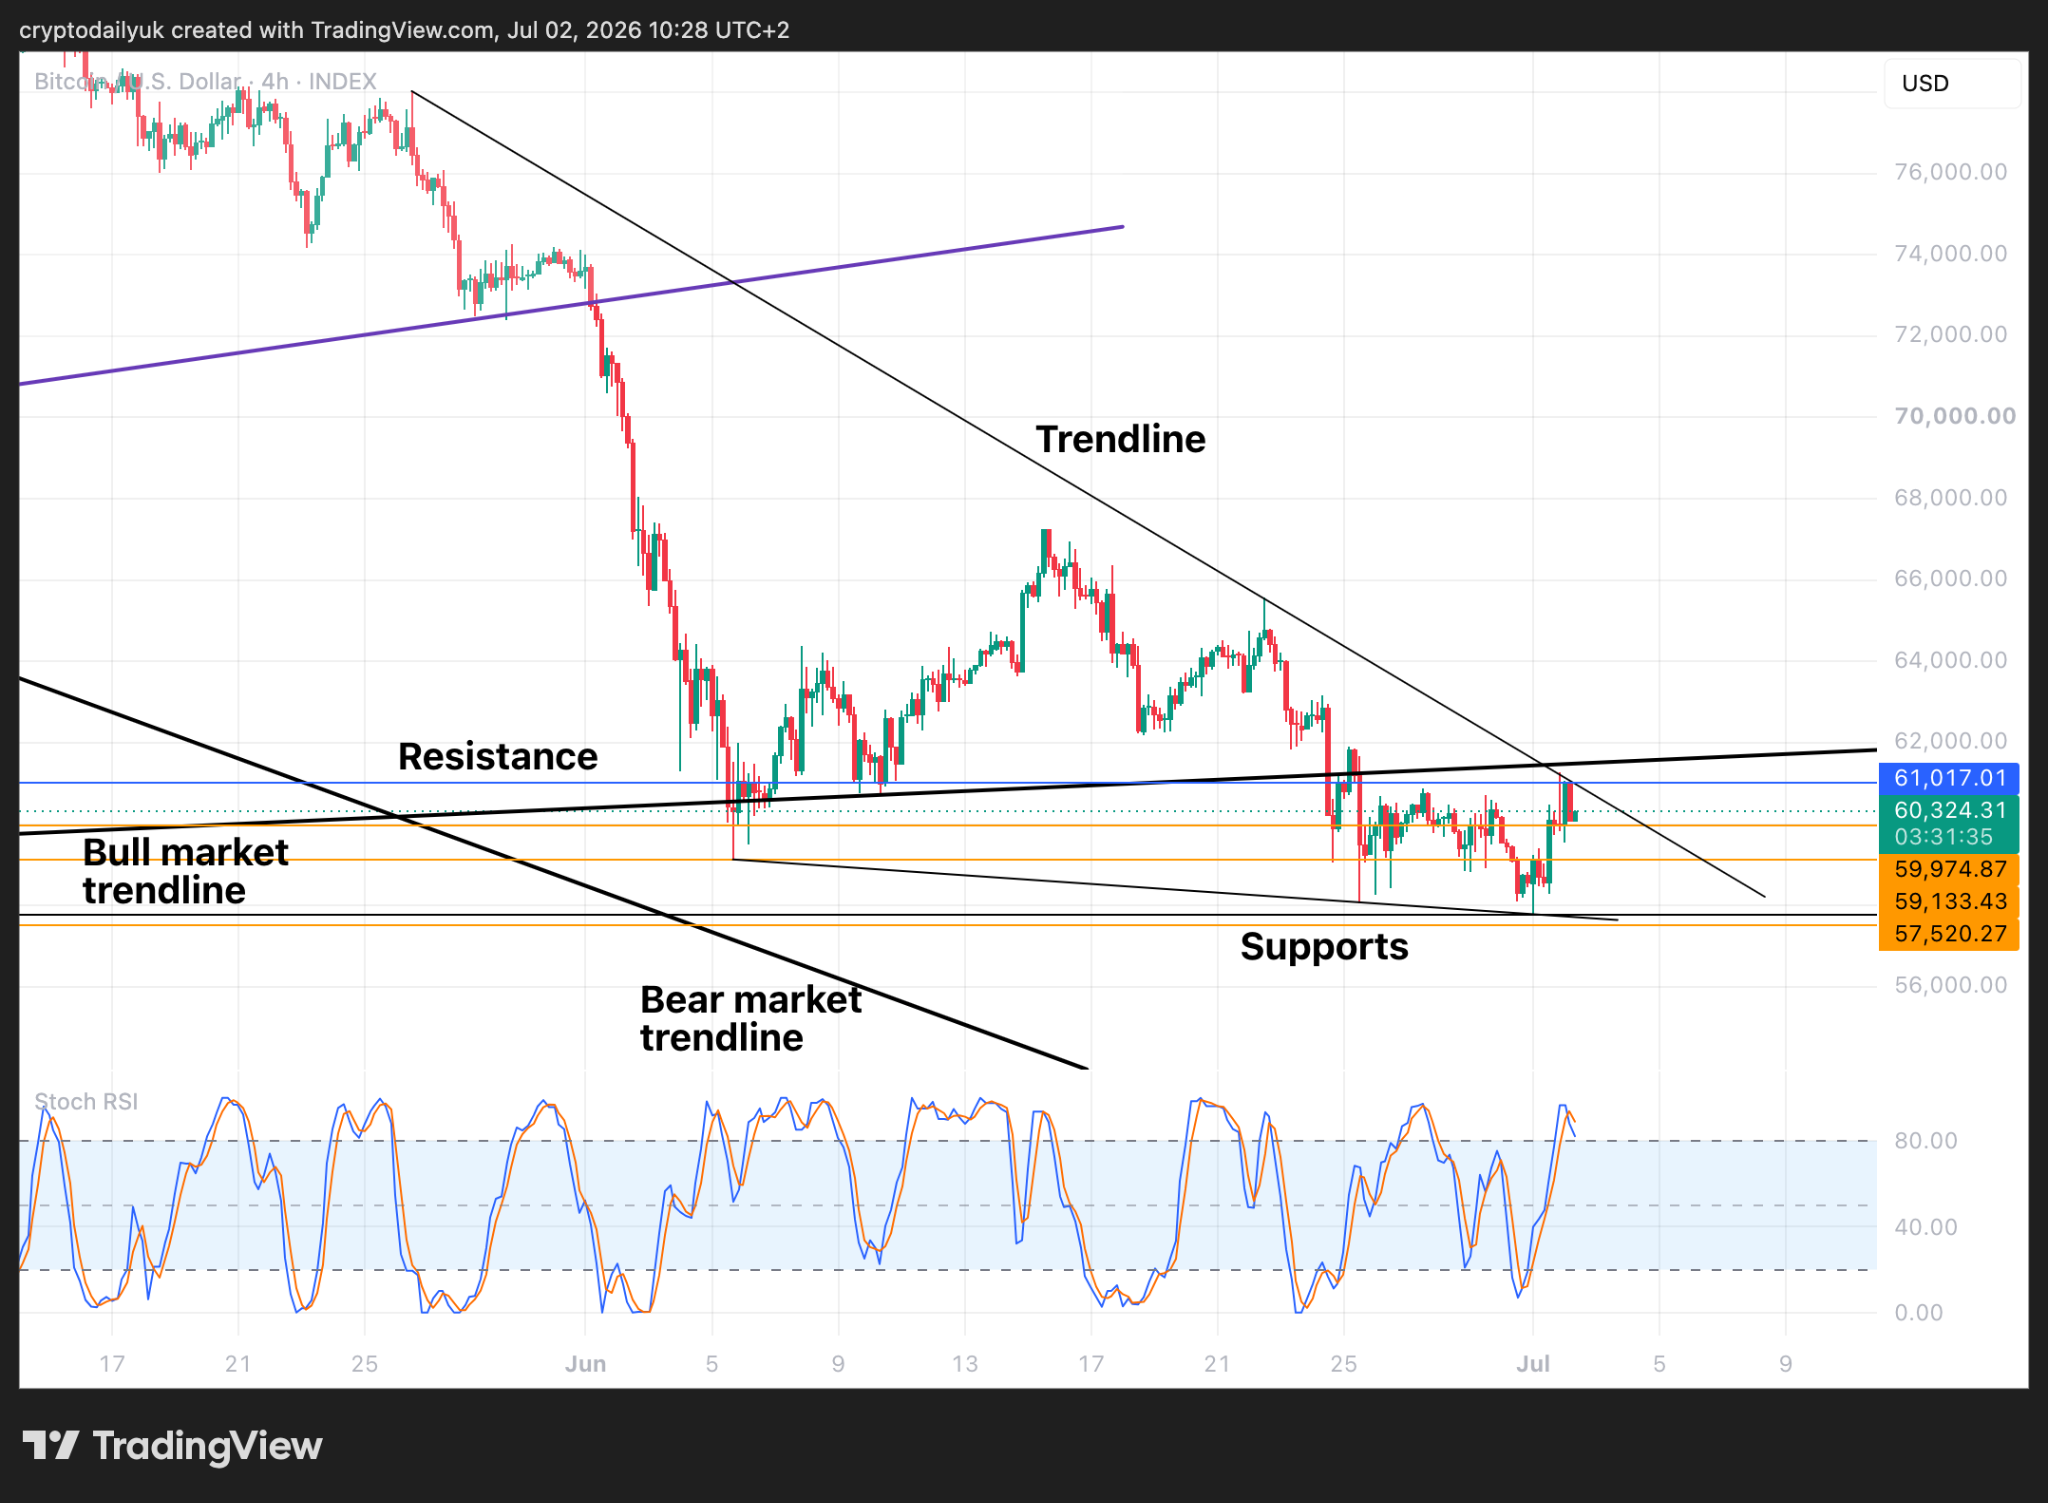
Source: TradingView

After reaching up to the $61,000 resistance level the $BTC price was rejected, has come back down to $60,000, and looks to be potentially confirming this level as support again. It can be seen that the price also tapped a descending trendline, which is going to make the $61,000 level that much harder to break through.
In Wednesday’s article it was brought to attention that an inverse cup and handle pattern may have been about to play out. However, since then, this recent rally has probably nullified the pattern by pushing the price above the top of the handle.
One thought on the current setup is that the descending trendline, together with the trendline that is forming support for the lows, could be depicting a falling wedge pattern. There are three touches to the top and three to the bottom, making this a valid pattern. The probabilities are more likely that the $BTC price will break up out of this pattern rather than down.
Should a breakout take place, the first target would be the last high at $65,500. Getting above $67,200 would be the second target, and the first step towards a potential trend change.
Wedge breakout targets + bullish divergence
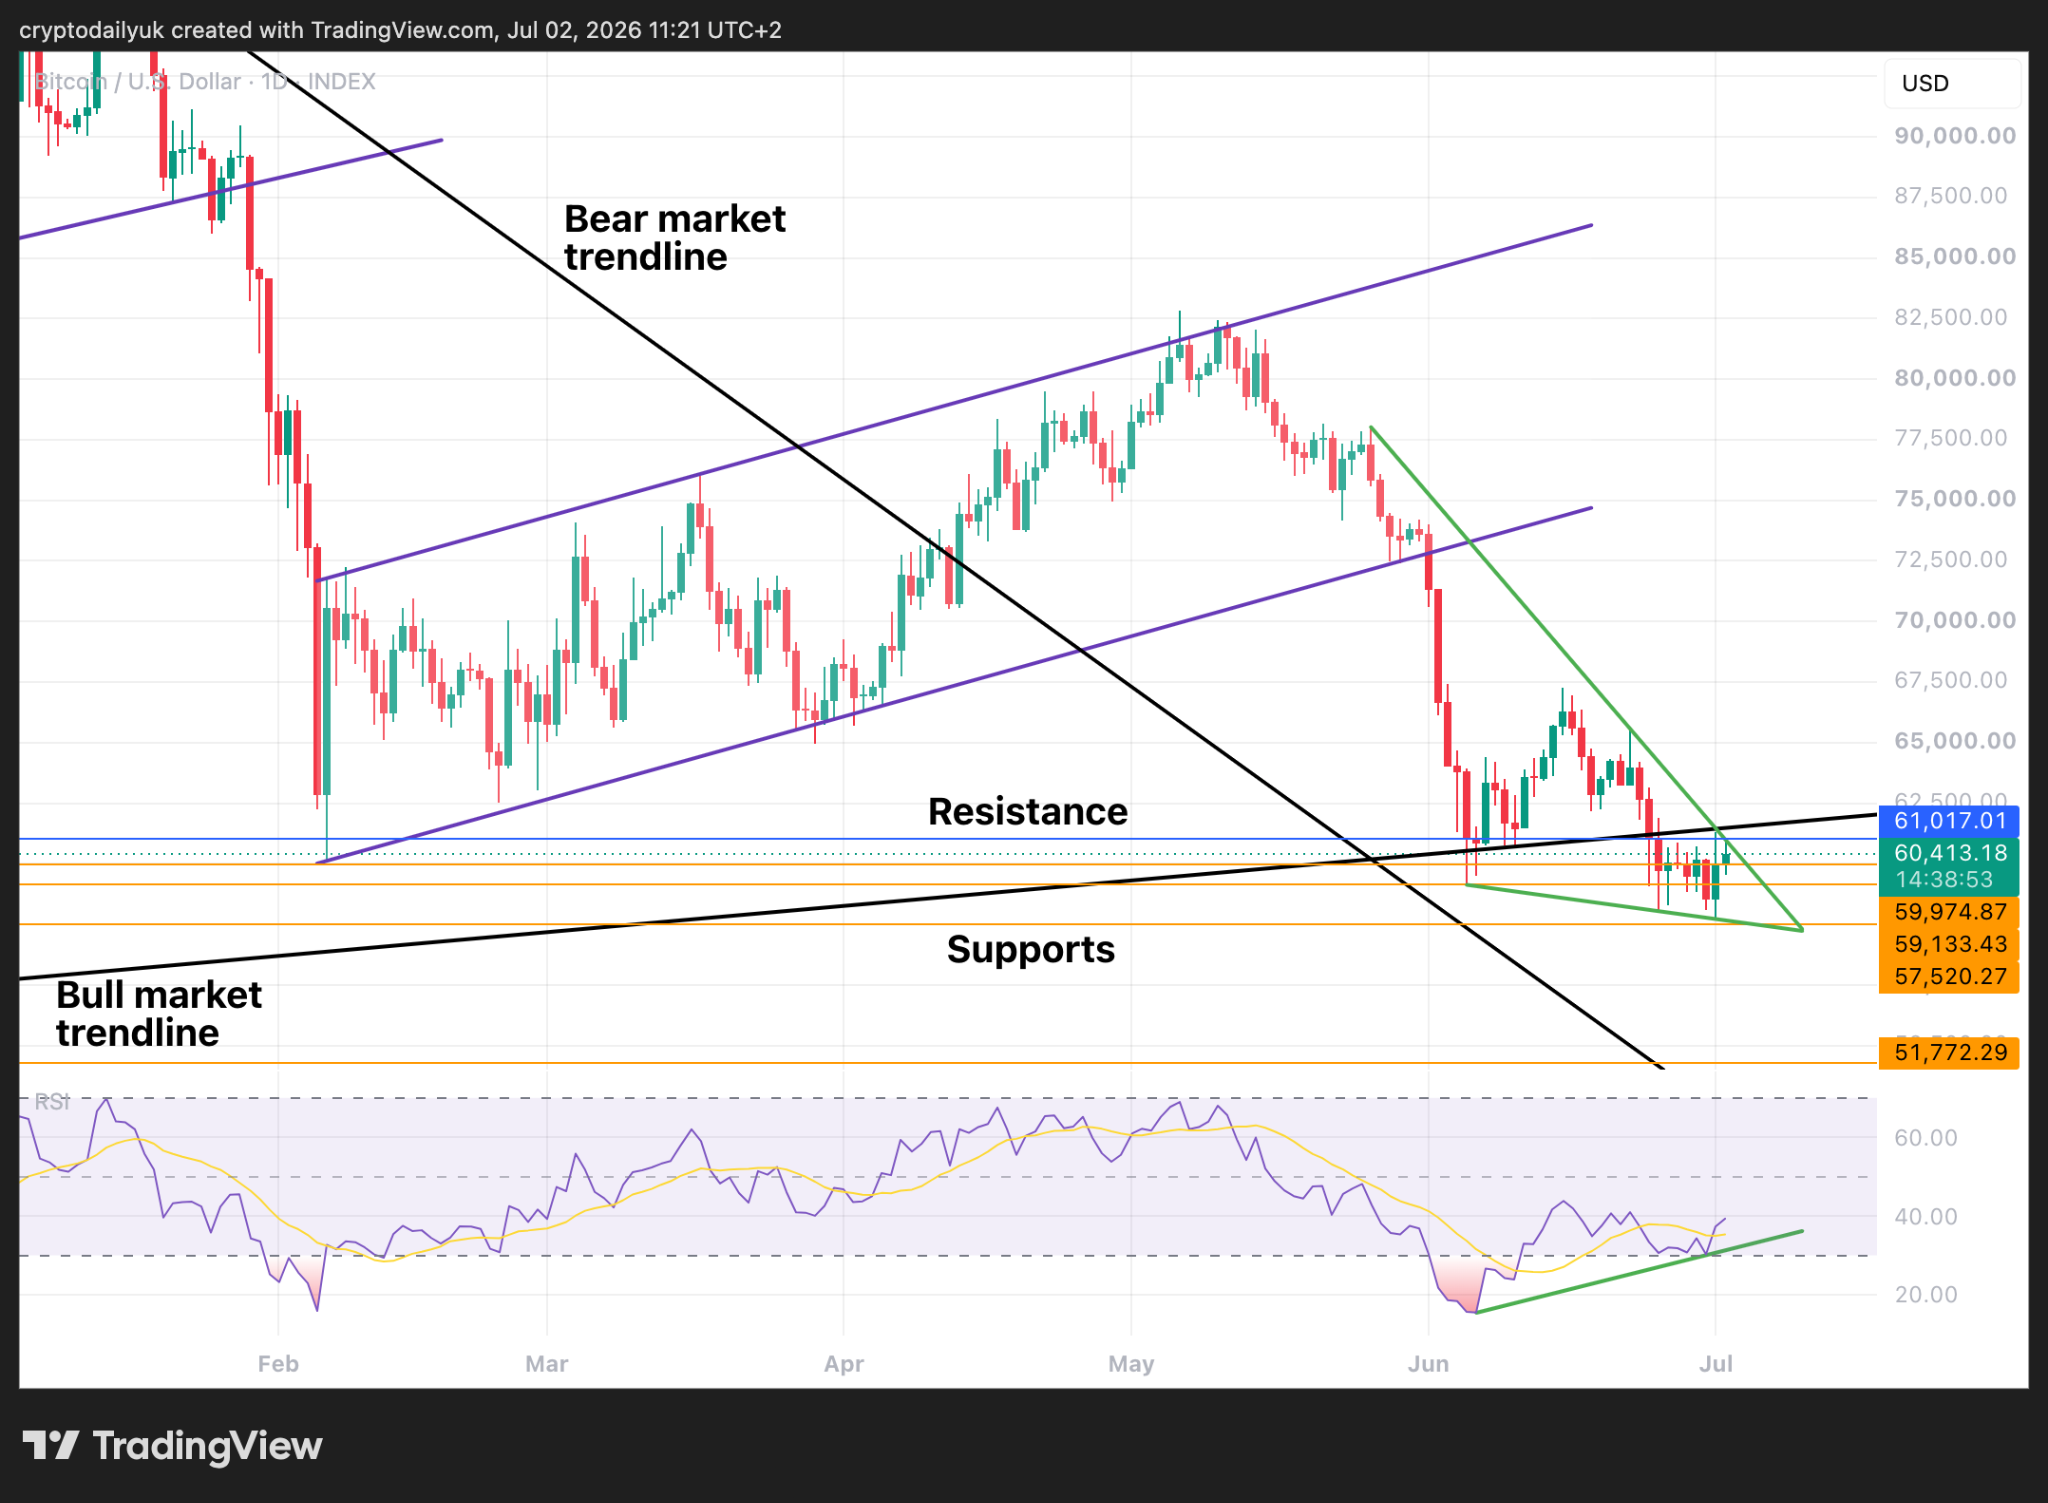
Source: TradingView
The daily chart puts the falling wedge more into perspective. This does make the current setup a lot more bullish and could provide the path out of the seemingly perpetual downtrend.
A breakout of the wedge to the upside, which is more likely than not, could lead to the $BTC price receiving a boost that could lift it back above the bull market trendline.
Also, if one looks at the Relative Strength Index (RSI), it can be seen that the indicator line is rising, which is in contrast to the price action. This is bullish divergence, and could be another factor for a decent upside rally.
Golden Fibonacci level bounce?
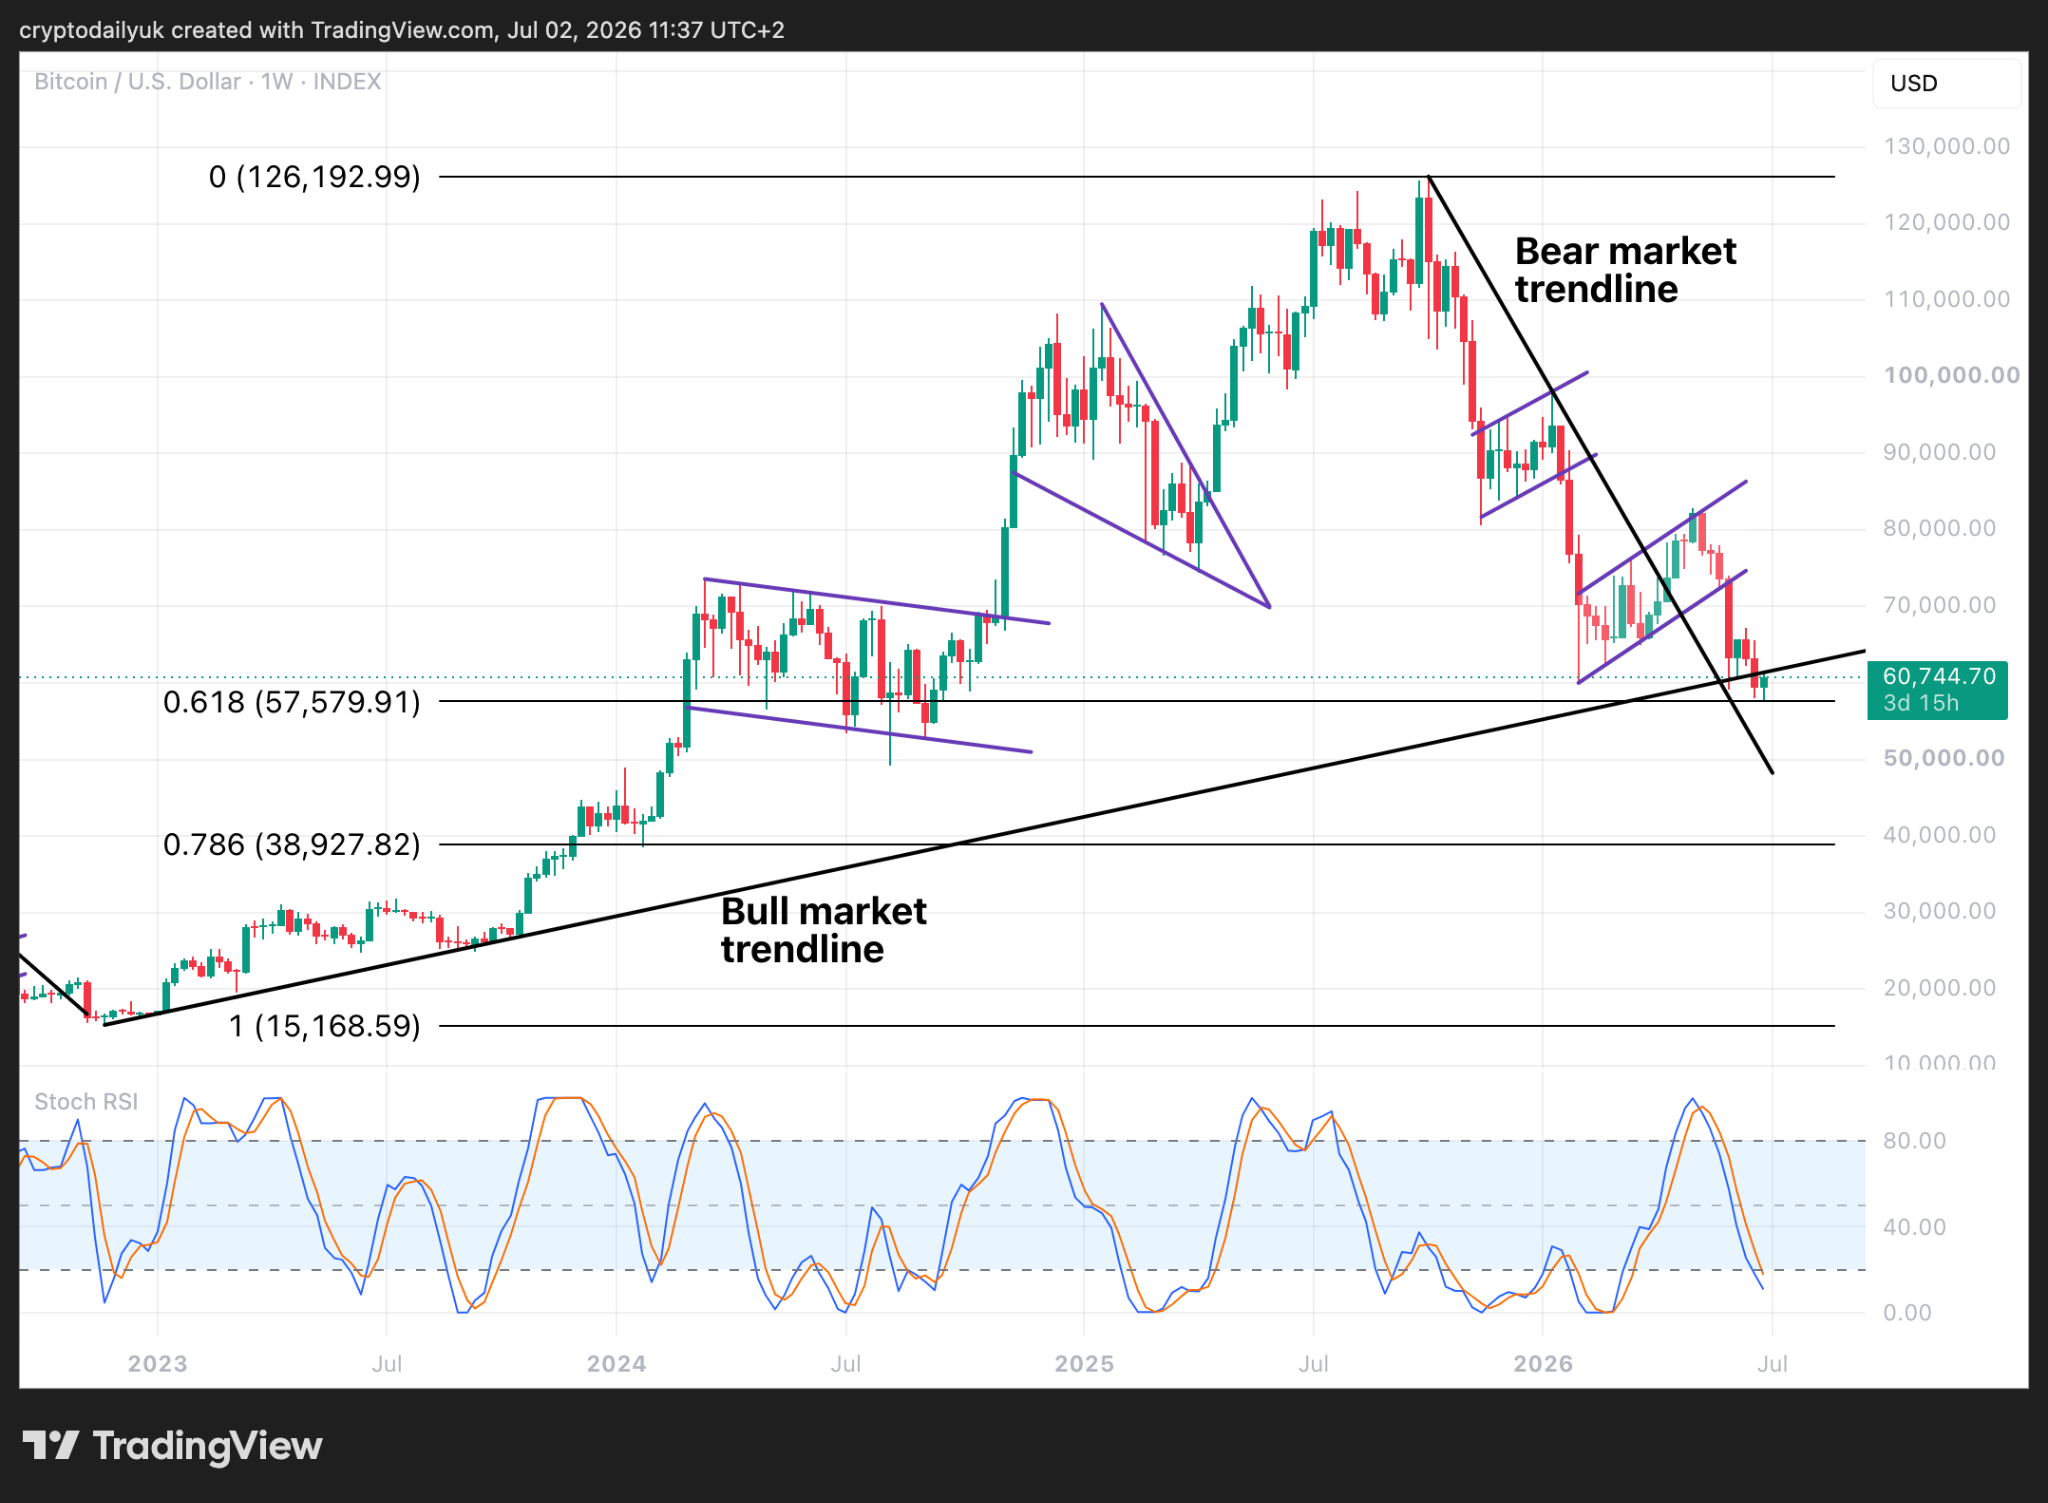
Source: TradingView
The weekly picture carries more weight given that it is a much higher time frame view. Here the bulls are possibly licking their lips. The reason for this is the Fibonacci sequence, taken from the very bottom of the last bear market to the absolute top of the previous bull market. It can be observed that the $BTC price came down perfectly to touch the 0.618 Fibonacci, the most important level of them all. As long as the price holds above this level, a bounce is a strong possibility.
There is still the matter of getting back above the bull market trendline, but trendlines are nowhere near as impactful as horizontal levels. If the price can get back above and hold there at the end of this week, the drop below will just be seen as a fakeout and nothing more.
One more potentially bullish factor are the indicator lines in the Stochastic RSI. They are nearly at the bottom. Once these turn back up and get above the 20.00 level, this signals upside price momentum. Could this be the momentum that takes Bitcoin back into a new bull market?
Disclaimer: This article is provided for informational purposes only. It is not offered or intended to be used as legal, tax, investment, financial, or other advice.


Be the first to comment