


What to know:
- Aave continues expanding on Mantle, with deposits nearing $1.5B and strong DeFi growth momentum.
- AAVE price remains bearish, trading below key resistance levels and major moving averages.
- RSI and MACD indicators show weak momentum, signaling continued downside risk and limited upside.

Aave, the decentralized finance lending protocol, is rapidly expanding its presence on the Mantle ecosystem as deposits surge toward $1.5 billion.
This growth reflects rising investor confidence and accelerating capital inflows into Layer 2 networks, where users are increasingly drawn to efficient, low-cost yield opportunities and scalable DeFi infrastructure supporting broader on-chain activity.
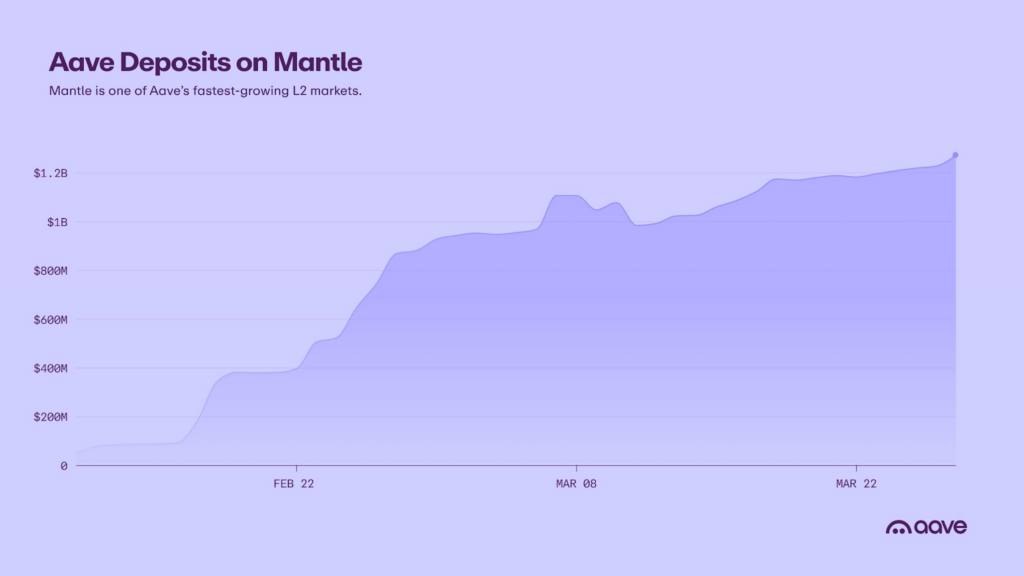
Source: Aave’s X Post

The momentum on Mantle highlights intensifying competition among modular blockchain ecosystems to attract liquidity and users.
Aave’s expansion signals stronger adoption of cross-chain DeFi strategies as both retail and institutional participants diversify exposure. If this trend continues, Mantle could solidify its position as a major hub for decentralized lending and liquidity growth in 2026.
Also Read: AAVE Near $100 as X Layer Expansion Fuels Momentum, Eyes $400 Target
AAVE Technical Outlook Shows Bearish Momentum
Despite this on-chain milestone, AAVE displays a definitive bearish trend characterized by lower highs and lower lows. According to TradingView, the price is trading around $94.96, positioned below major exponential moving averages.
The EMA 200 acts as overhead resistance, while the EMA 20 provides immediate pressure. Consolidating near the $92.00 support zone, the overall market structure remains quite heavy.
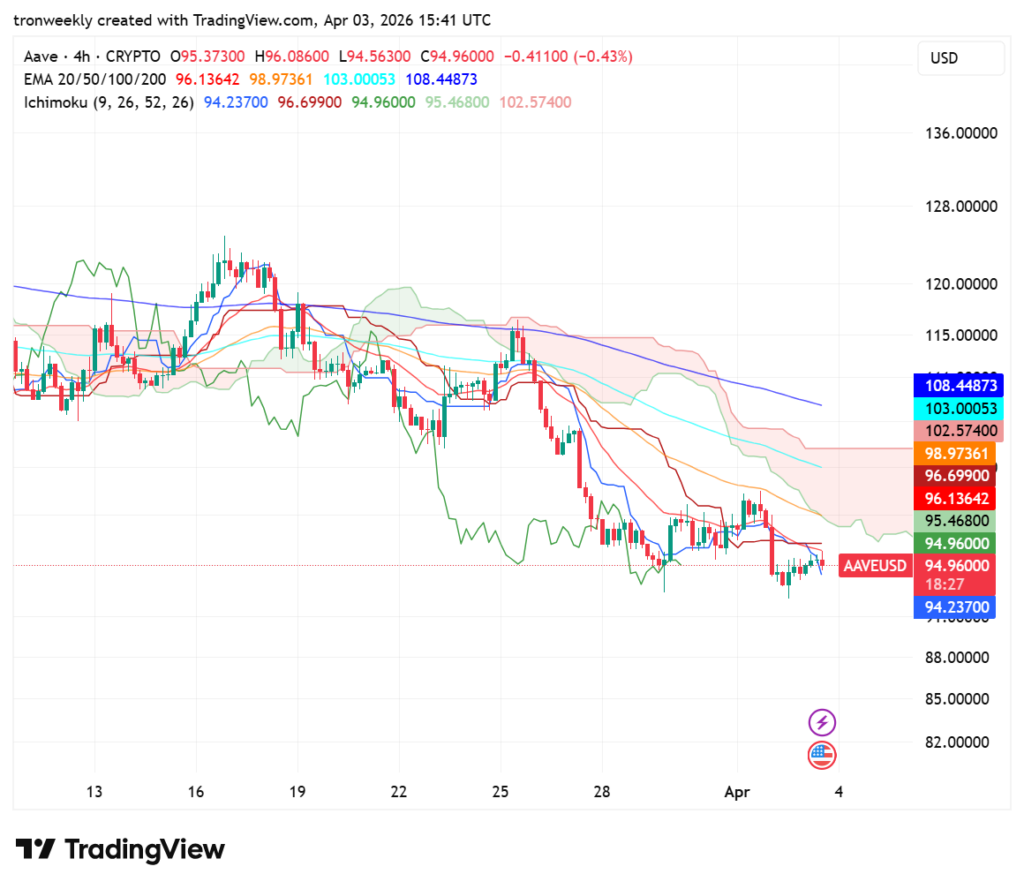
Source: TradingVIew
Looking at Ichimoku Cloud, the market picture remains bearish since the price is trading below the Kumo. As it can be seen from the chart, the red Kumo is becoming thicker, indicating that downward pressure will continue, and any rally will find resistance along the way.
In order to reverse the trend, AAVE needs to overcome the resistance level of $96.70 and reach $102.57.
Momentum Indicators Reinforce Bearish Pressure
The RSI reading for AAVE is presently hovering around 41.87, suggesting a negative inclination without falling into the oversold region. Located beneath the yellow signal line on the oscillator, it signals a stage of low momentum and consolidation of prices.
Although far from being in the oversold region, the absence of upward curvature implies a reluctance among buyers to push up prices.
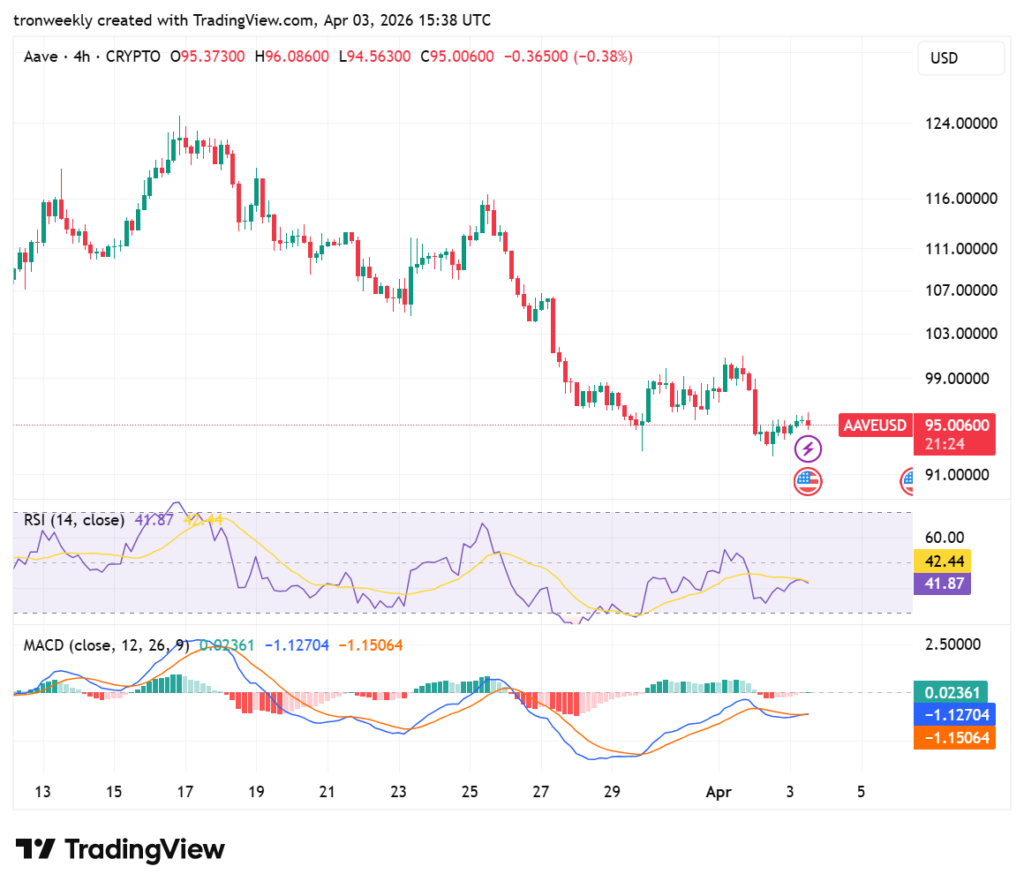
Source: TradingView
The MACD has created a small bullish crossover below the zero line, indicating that the token may be seeing a relief rally rather than an outright reversal in the trend.
Even though the histogram is now showing green colors, the two lines have yet to move into positive territory from their deeply negative positions.
This article contains market analysis and price predictions. These are not guarantees. Crypto markets are volatile. Always DYOR. Not financial advice.
Also Read: Aave V4 Launch Marks New Era in DeFi: Will AAVE Surge to $240 Resistance?

Be the first to comment