


What to know:
- Celestia (TIA) is consolidating inside a descending channel, suggesting a possible breakout.
- RSI stays near neutral while MACD hints at a bullish crossover, showing weakening bearish pressure.
- Buyers are slowly gaining strength as price tests resistance, raising chances of a move toward $1.2 if momentum builds.

Celestia (TIA) is moving in a consolidation phase with the changing conditions in the crypto market after a prolonged downtrend. According to CoinMarketCap, as of Thursday, April 9, the TIA price has declined by 4.12% over the last 24 hours, but it remains up by 4.47% over the last week.
At the time of writing, TIA is trading at $0.2962, with a trading volume of $331.19 million, which has declined by 25.94% over the last 24 hours. However, its market capitalization stands at $267.29 million, which has also declined by 4.07%.
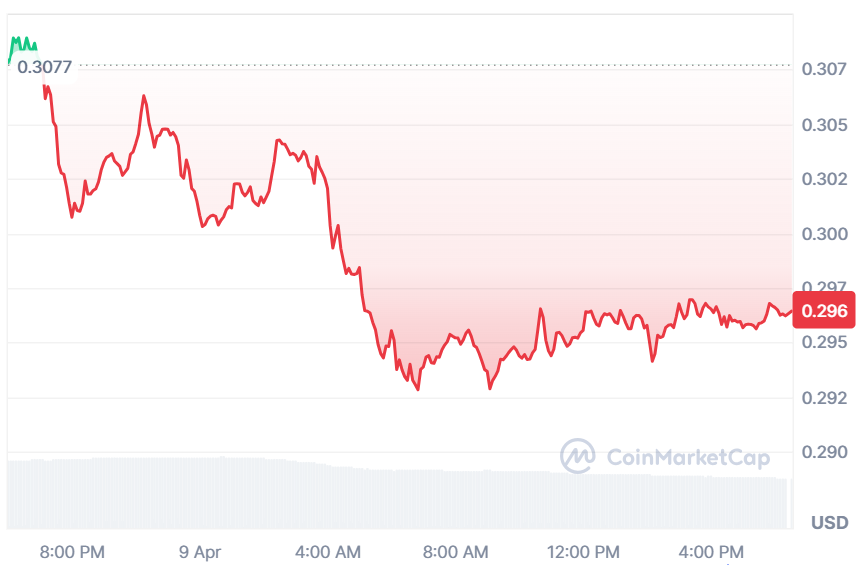
Source: CoinMarketCap

Also Read: Celestia (TIA) Holds Critical $0.20 Level, Targets $0.63 Breakout
TIA Price Setup Signals Bullish Breakout Toward $1.2
Furthermore, the crypto analyst Butterfly revealed that TIA is showing early signs of a potential breakout as it presses against the upper boundary of a well-defined descending channel on the daily timeframe.
The structure reflects prolonged corrective movement, but price compression suggests weakening bearish momentum. Market participants are now watching closely as volatility tightens near a critical resistance zone.
Technical behavior indicates that buyers are gradually gaining influence, with reduced downside follow-through and repeated attempts to challenge resistance. This often signals accumulation within a bearish trend, where selling pressure starts to fade.
If bullish momentum strengthens and volume expands, a decisive breakout above the channel could confirm a shift in market structure.
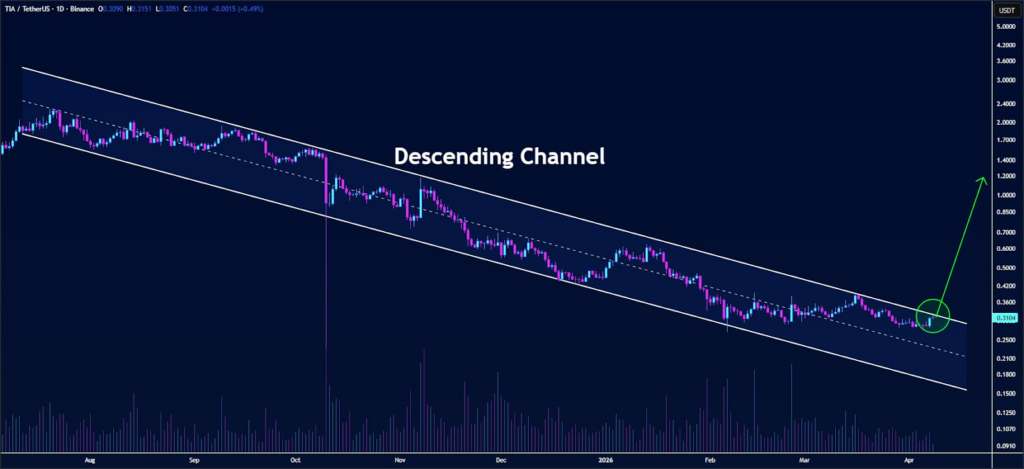
Source: Butterfly’s X Post
In case of breakout, the momentum may pick up rapidly due to the strength witnessed. The next resistance level for TIA would be expected around the $1.2 mark. If there is an inability to breach resistance, rejection may follow, and consolidation will persist inside the trading channel.
Momentum Indicators Point to Cautious Optimism
According to TradingView, RSI stands at 43.82, maintaining its position in the neutral zone slightly below the middle level.
Even though it is holding above the oversold level of 30, the positive slope above the 39.05 signal line indicates that there is some easing in selling pressure. But since it is unable to move above 50, the trend momentum is cautiously weak.
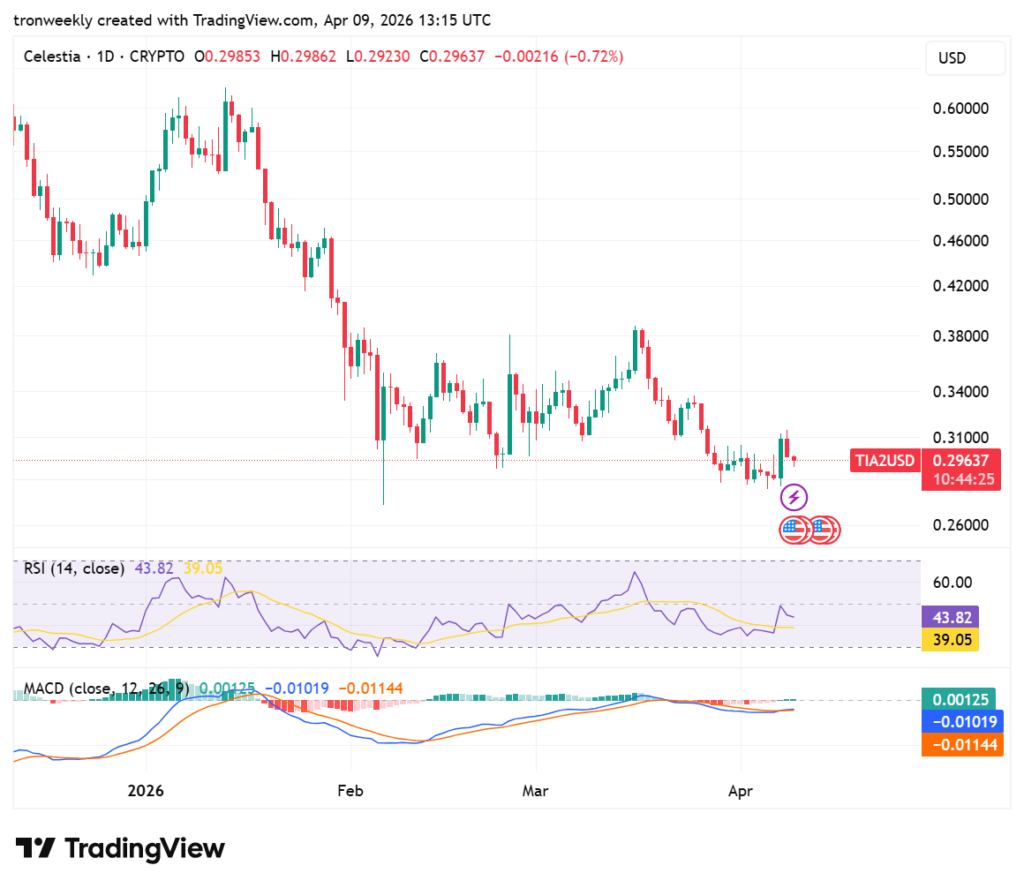
Source: TradingView
The MACD is confirming a downtrend, as can be seen from the two lines remaining below the zero level. Even so, a bullish crossover is coming into view, due to the MACD line moving to -0.010 as compared to the signal, which is at -0.011. The emergence of green bars in the histogram is a sign that the bears have become exhausted.
This article contains market analysis and price predictions. These are not guarantees. Crypto markets are volatile. Always DYOR. Not financial advice.
Also Read: Celestia (TIA) Accumulation Zone Hints at an Explosive Rally Toward $21

Be the first to comment