


What to know:
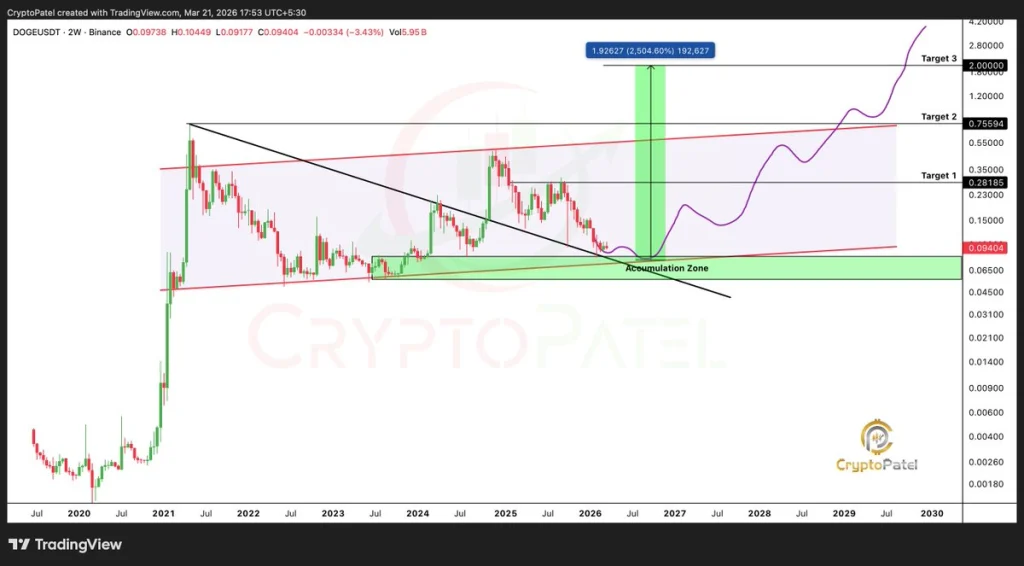
- Dogecoin could surge to $0.28, $0.50, $1.00, or $2.00, offering early investors potentially massive returns.
- DOGE is currently below key exponential moving averages, signaling strong bearish momentum in the market.
- RSI at 37.80 and MACD below zero indicate selling pressure, though stabilization may be approaching.


Dogecoin is capturing investor attention as a new breakout pattern emerges. According to the crypto analyst Hailey LUNC XRP, historically, setups like this have delivered life-changing gains for early movers.
Hailey LUNC XRP is eyeing key milestones: $0.28, $0.50, $1.00, and $2.00. Each level represents a step toward potential momentum, with the possibility of returns exceeding 2,500% if history repeats itself.

Source: Hailey LUNC XRP’s X Post
For investors ready to act, DOGE could be more than a meme; it may ignite the next wave of crypto wealth. Recognizing patterns and timing entries are crucial.
Those who move early could see small positions grow into substantial gains, riding a surge reminiscent of some of crypto’s most remarkable and transformative success stories.
Also Read: Dogecoin (DOGE) Eyes Multi-Year Gains as Bull Pennant Emerges on Monthly Chart
Dogecoin Technical Outlook Shows Bearish Momentum
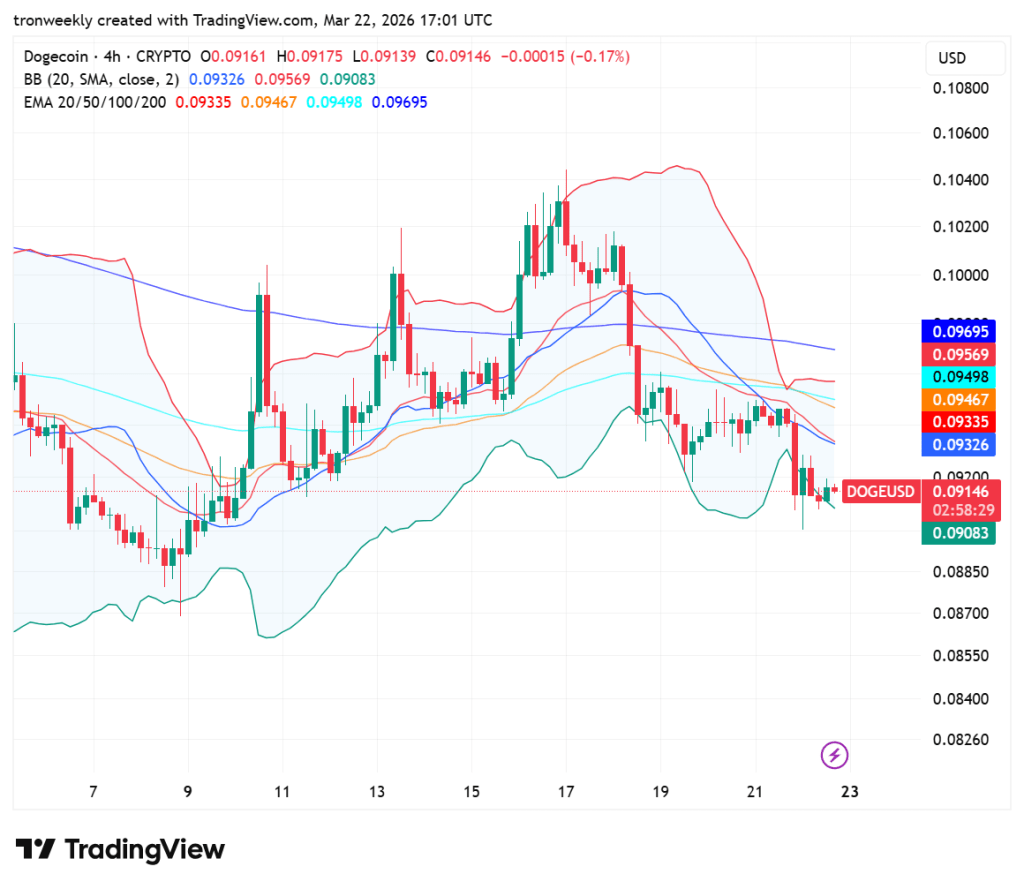
According to TradingView, DOGE shows a clear move away from the mid-March highs and into a corrective phase. As the price failed to hold above $0.1040, it fell back down to $0.09146.
The price is now stuck around the lower Bollinger Band at $0.09083, showing strong bearish power. The falling price shows that sellers are in charge at the moment, while buyers are still largely absent.
Source: TradingView
From a technical analysis perspective, the price has plummeted through all the major EMAs, which range from $0.0933 to $0.0969. These EMAs have become significant resistance to any potential upward movements from the current price.
Unless the 20-EMA at $0.0933 is reclaimed, the path of least resistance is towards the psychological support at the $0.0900 mark.
Momentum Indicators Supports Downward Pressure
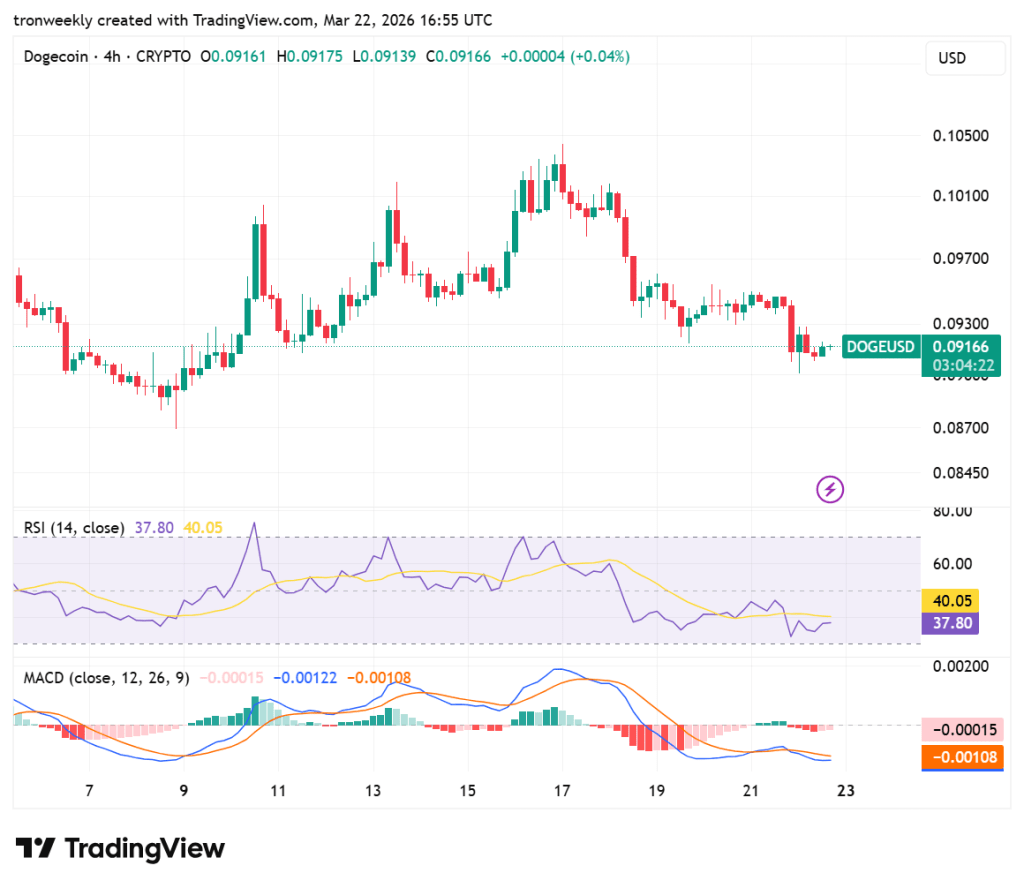
Currently, the RSI indicator of DOGE is at 37.80, indicating a bearish trend, as it is below the 50 neutral value. This shows that the sentiment of the market is bearish in the 4-hour time frame.
As the purple RSI line is still below the yellow RSI signal line at 40.05, it shows that the bearish trend is still prevalent in the market. The RSI indicator has not yet touched the oversold zone below 30.
Source: TradingView
The MACD lines are currently trading low on the baseline, which indicates an ongoing bearish trend. The MACD line is currently trading low on the baseline at -0.00122, which is slightly lower than the signal line at -0.00108.
Despite the fact that the histogram is showing a declining trend in the red bars, it is still important to see a bullish crossover.
This article contains market analysis and price predictions. These are not guarantees. Crypto markets are volatile. Always DYOR. Not financial advice.
Also Read: Dogecoin Volume Jumps 420% as Rally Signals Strengthen
Be the first to comment