


What to know:
- Aptos joins Mastercard’s Crypto Partner Program to accelerate adoption of on-chain payments.
- The APT price remains under bearish pressure, trading below key EMA levels after a sharp pullback from recent highs.
- RSI shows recovering momentum from oversold conditions, while MACD indicates fading bearish strength

Aptos is stepping into the spotlight as on-chain payments gain momentum, joining forces with global payments leader Mastercard, through its newly launched Crypto Partner Program.
The initiative aims to bridge blockchain technology with traditional financial systems, signaling a significant move toward integrating digital assets into everyday transactions at a global scale.

Source: Aptos’ X Post

As a launch partner, Aptos Labs brings its high-performance blockchain infrastructure to support Mastercard’s vision for real-time, scalable payment solutions.
The collaboration underscores rising institutional confidence in onchain finance, where faster settlement, reduced costs, and programmable transactions could transform cross-border payments and modernize global financial networks.
Also Read: Aptos (APT) Eyes $2 Target as Breakout Challenges Long-Term Downtrend Resistance
APT Technical Outlook Points to Consolidative Movement
Despite this major partnership, APT is also showing a strong reversal pattern after reaching the peak on March 25th at about 1.10.
According to TradingView, after this peak, the price of the token is showing a strong bearish trend, dipping below significant moving averages. Currently, the token is trying to consolidate at 0.9132, just above the lower Bollinger Band support.
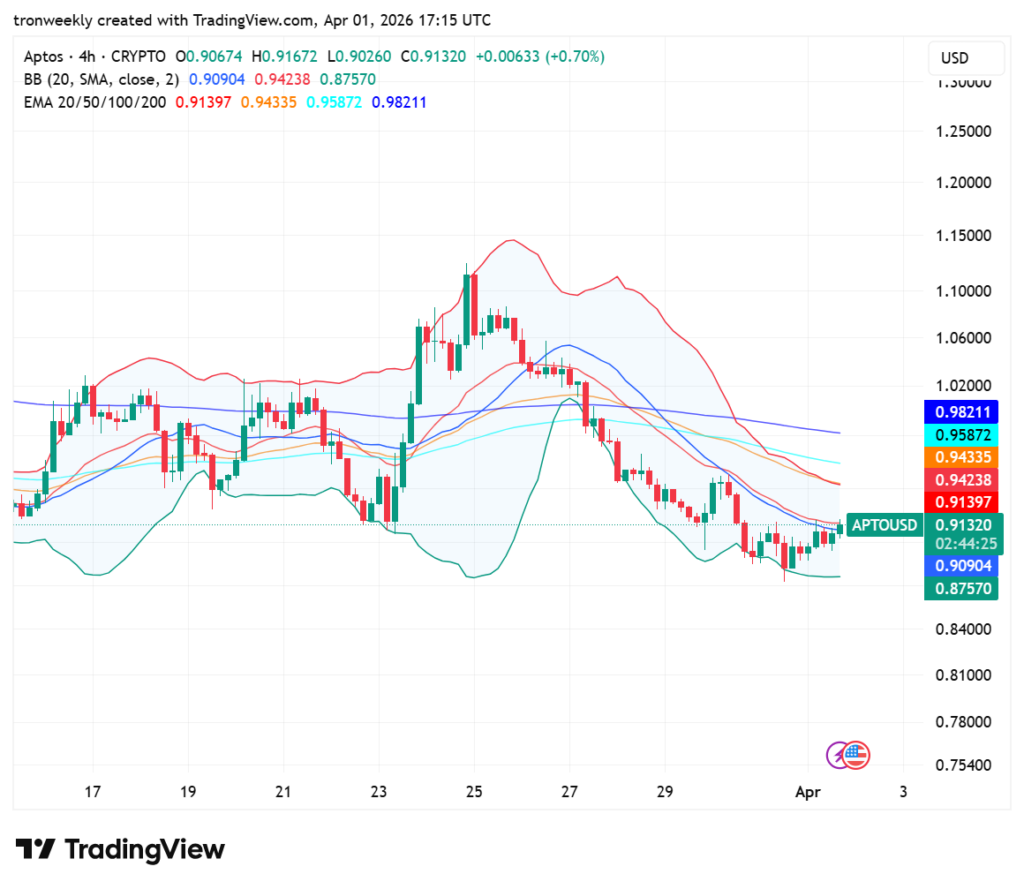
Source: TradingView
Technical indicators are consistent with a bearish scenario, as the 20, 50, 100, and 200 EMAs are stacked up as a resistance level. The asset’s price is currently stuck below the 20-period EMA at $0.9139.
Unless the bulls are able to push the asset’s price above the 200 EMA at $0.9821, the asset’s price is at risk of falling further and testing the immediate support level at the $0.8757 mark.
Momentum Indicators Show Neutral Outlook
The Relative Strength Index (RSI) is currently at 46.75, indicating a neutral and recovering momentum. The RSI, after almost touching the oversold zone, is rising above its signal line, which is at 37.12.
The rising trend indicates that the selling pressure is easing, and buyers are taking over without reaching the overbought zone.
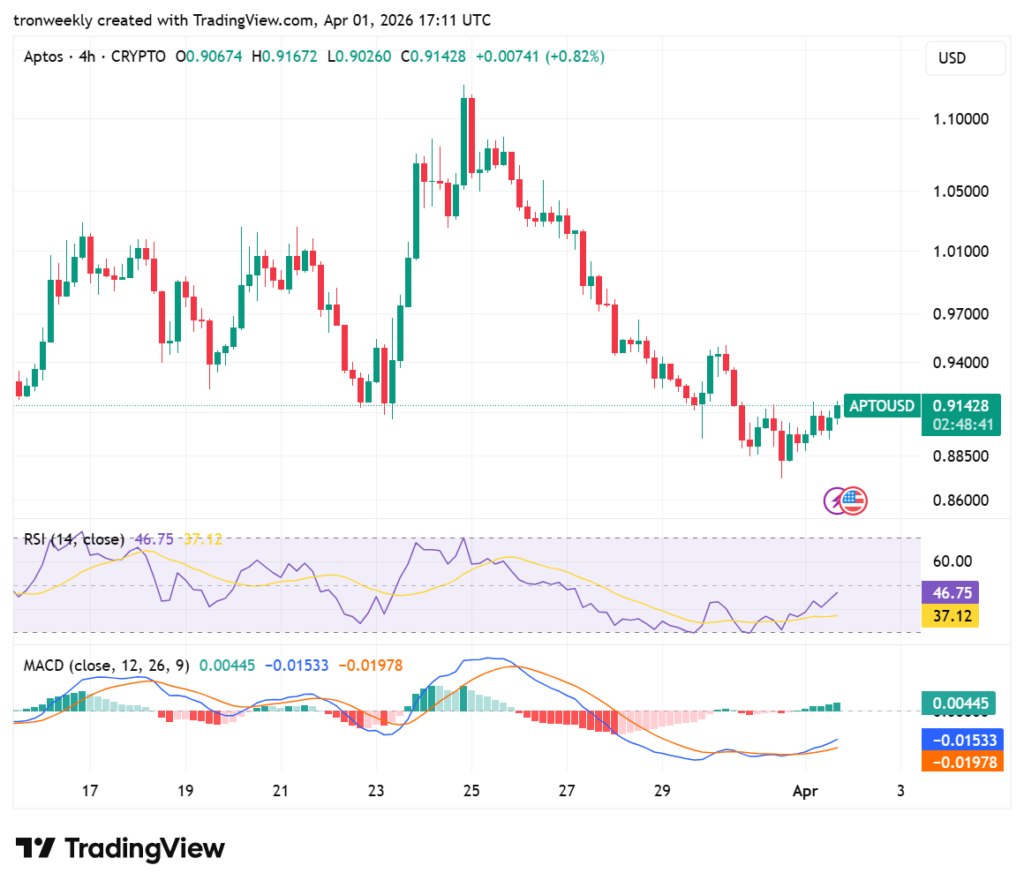
Source: TradingView
The MACD indicator is reflecting a bullish crossover, where the blue line is moving above the orange signal line. Even though it remains below the zero level, the bar on the histogram is now reflecting a green color at 0.00445.
It is a confirmation that bearish energy is decreasing and giving way to increasing bullish momentum, which may cause a reversal in the price action.
This article contains market analysis and price predictions. These are not guarantees. Crypto markets are volatile. Always DYOR. Not financial advice.
Also Read: Aptos (APT) Activity Surges to 264.5M Transactions Despite Bearish Price Action

Be the first to comment