


What to know:
- HyperliquidX surpasses $1.3B market cap, signaling strong momentum in tokenized asset growth and decentralized trading adoption.
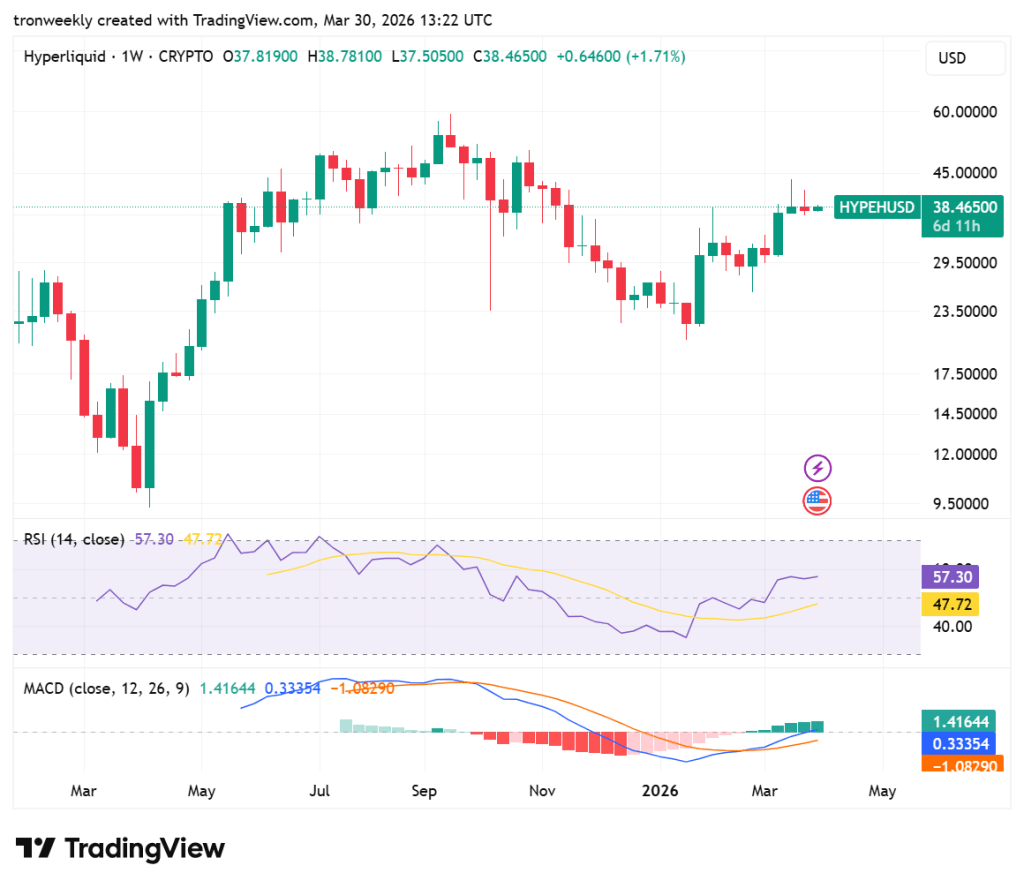
- Technical indicators like RSI at 57.30 and bullish MACD crossover confirm strengthening upward momentum.
- Analysts warn of a possible liquidity-driven shakeout toward $34–$35 before a potential rally toward the $45 resistance zone.

HyperliquidX has seen its tokenized assets market capitalization surpass $1.3 billion, marking a major milestone in decentralized trading growth.
According to the crypto analyst curb.sol, the surge is driven by expanding liquidity and rising demand for stable settlement assets, with USDC issued by Circle acting as the dominant liquidity backbone across the platform, supporting on-chain trading efficiency and stability growth cycles.
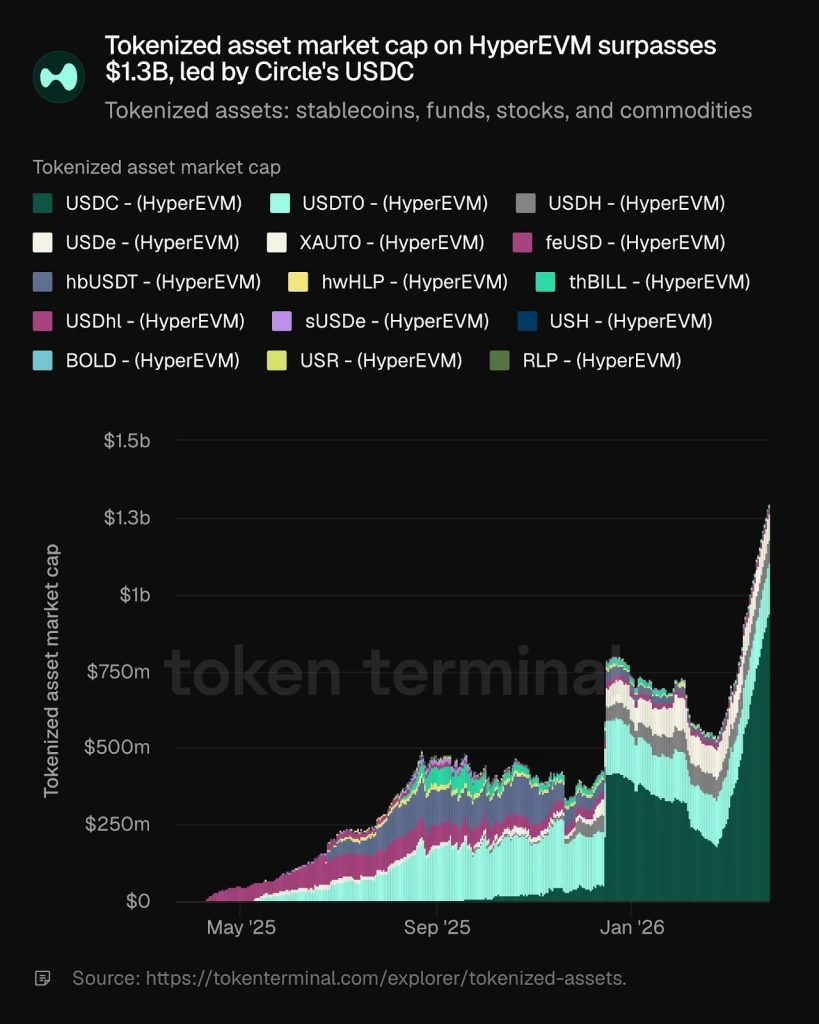
Source: curb.sol’s X Post

Market implications extend beyond valuation metrics, signaling stronger confidence in tokenized financial infrastructure across decentralized markets.
With Circle-issued USDC continuing to anchor liquidity across HyperliquidX ecosystems, the market reflects growing adoption of blockchain-based settlement systems, enabling faster and more efficient global trading flows, reinforcing a shift toward tokenized finance adoption across digital asset markets.
Also Read: Hyperion DeFi Rockets 87% Q4 Profit With Triple-Dip HYPE Strategy
HYPE Signals Possible Shakeout Before Next Rally
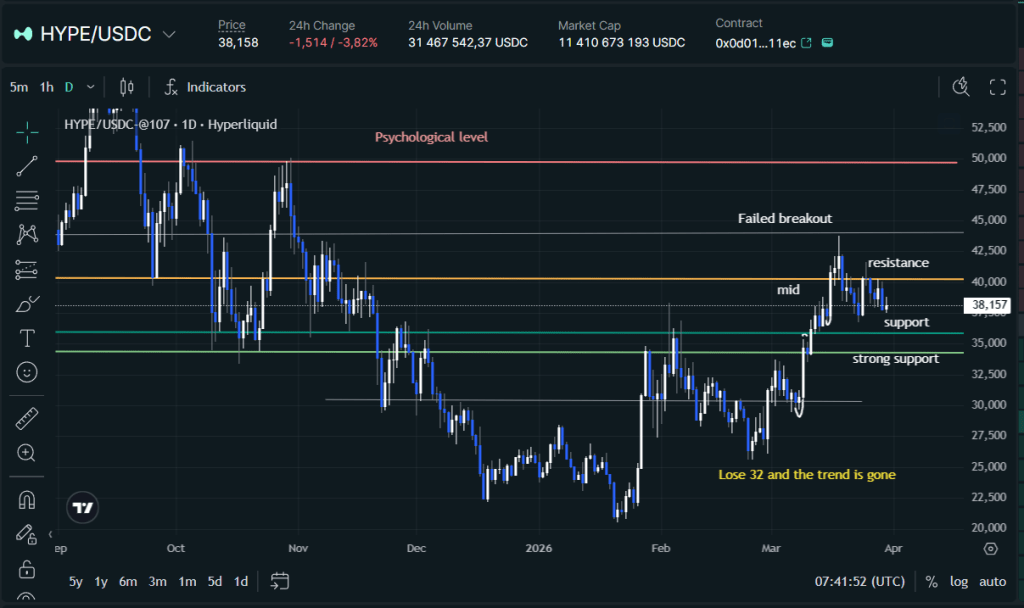
Apart from this major milestone, HYPE has been trading close to the key resistance mark of $38, yet it is doing so in a stable manner without any sharp decline.
According to crypto analyst Havoc.hl, it is believed that traders are viewing this stability in HYPE in a positive light, suggesting that the token is possibly absorbing its gains in preparation for an upward breakout if selling pressure continues to ease off.
Source: Havoc.hl
Despite the sideways action, the level of caution remains high due to the current market volatility and the suspected manipulation.
There are analysts that believe that the price might fall back to the $35-$34 levels as traders seek liquidity and trigger the stops before any rally. This might be seen as a shake-out and might provide a clean technical setup.
HYPE Technical Outlook Reveals Bullish Optimism
According to TradingView, the weekly chart of HYPE’s price action displays a dramatic move from its 2026 low of $23.00.
Currently trading at $38.46, it is displaying a string of rising bullish candles, gradually moving back into the mid-range. This move is suggestive of changing market sentiment, with its next major obstacle being in the $45.00 region.
Source: TradingView
Moreover, technical indicators also point towards a bullish outlook. The RSI indicator is on the rise, reaching levels of 57.30. This indicates that there is momentum building up in the market.
However, at the same time, the MACD indicator also shows that there is a bullish crossover. The histogram is also turning green for the first time in months, which indicates that the trend reversal has good potential.
This article contains market analysis and price predictions. These are not guarantees. Crypto markets are volatile. Always DYOR. Not financial advice.
Also Read: Hyperliquid (HYPE) Shows Strength: Will $43.7 Unlock Next Rally?

Be the first to comment