


What to know:
- Dogecoin breaks out of a triangle pattern as momentum indicators turn positive.
- Price faces resistance near $0.103–$0.11 with a possible retest of support at $0.096.
- A successful hold above support could open the path toward $0.13 and higher.


Dogecoin has started to show early signs of strength after weeks of sideways movement and pressure from sellers. Trader Tardigrade pointed to a clean breakout from a descending triangle on the daily chart, a structure that often forms before a change in direction.
This pattern had been building for some time, with price repeatedly testing a flat support zone while forming lower highs under a falling resistance line.

The limited range indicated that sellers were losing their grip, and buyers were slowly regaining their grip. As the price approaches the top of the triangle, volatility decreased, which is a setup for a significant move.

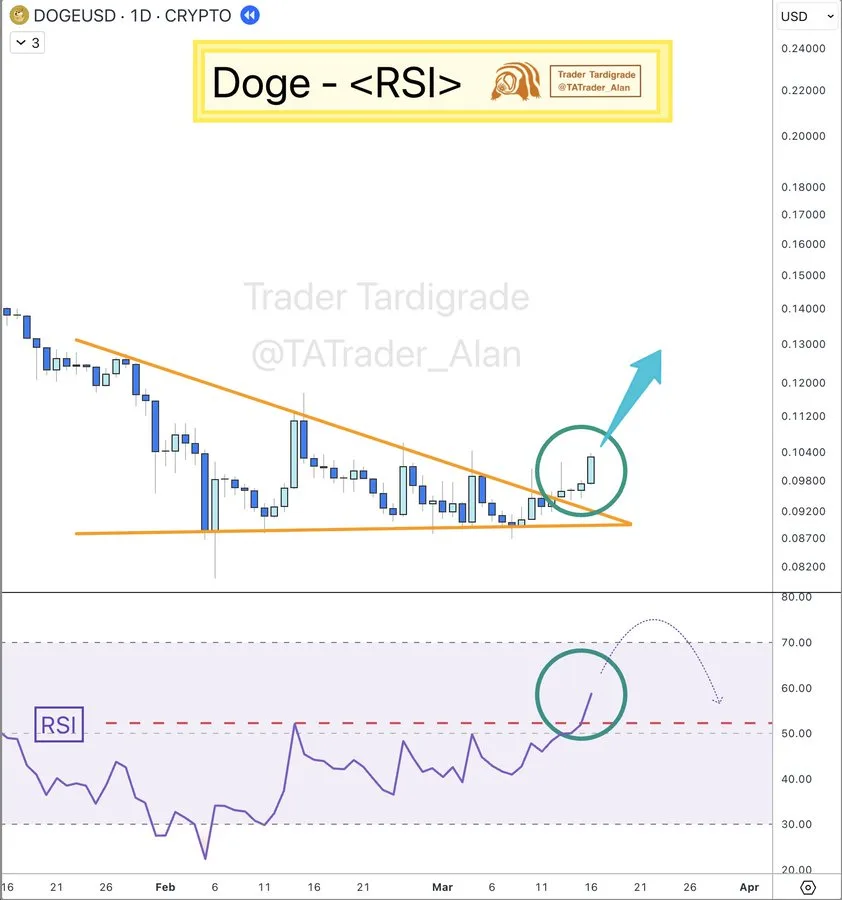
Recent candles have stronger bullish bodies and higher lows, indicating that accumulation is taking place.
However, the breakout attempt on the upper trendline makes traders pay attention to whether buyers can close the day above the resistance. If they manage to do so, it is an indication that the structure has changed, and the recent trading range is over.
RSI Strength Supports Bullish Case
Momentum indicators are also aligning with the price. The Relative Strength Index is above the middle line, and people look at that to see if the buyers or sellers are in control.
Before that, the indicator was low, indicating the long downtrend in the past. Now, it’s rising, indicating higher levels.
This rise in RSI, as the prices remain constant, indicates a divergence, which is usually a sign before prices rise. If the RSI is headed towards the 60-70 range, it indicates increased buying pressure.
This constant rise also indicates that buyers are entering the market rather than waiting on the sidelines. All these factors indicate that prices are headed for a breakout, especially when a pattern is formed and support levels are tested repeatedly.
Also Read: Dogecoin Tests Key Resistance as Breakout Targets $0.151 Amid Bitcoin Volatility
Dogecoin Key Levels Define Next Move
Sniper Trading highlighted that Dogecoin has had a strong movement last week and is currently re-testing an important resistance area. The first resistance area is between $0.103 and $0.11.
This resistance area was previously an area where the price would dip before, and now it is being tested from below. The price will dip slightly to $0.096, and this could be considered a test where resistance becomes support.

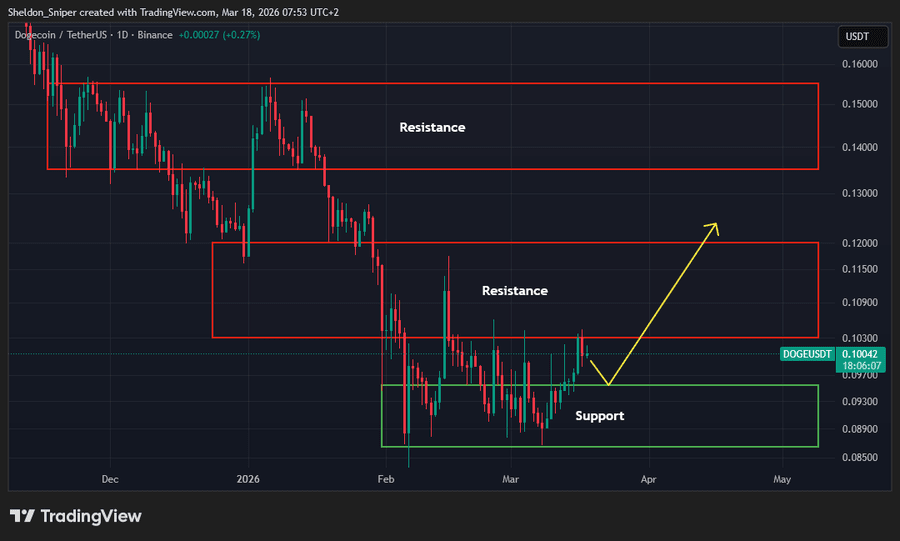
This area is also part of a larger demand zone from $0.085 to $0.095, where support has been provided many times since mid-February.
This area is essential in maintaining the current uptrend. If this support level holds, the next resistance levels are revealed.
The initial resistance level is between $0.103 and $0.12, then the next level is between $0.135 and $0.155. These are the areas where the selling pressure could return, especially the $0.13 level, which was the distribution zone.
This article contains market analysis and price predictions. These are not guarantees. Crypto markets are volatile. Always DYOR. Not financial advice.
Also Read: Dogecoin (DOGE) Breakout Signal Points to Explosive $0.15 Rally

Be the first to comment