


What to know:
- Ethereum breaks inverted head and shoulders pattern, signaling potential near-term trend reversal.
- Institutional buying surges with $152M ETH purchase by Tom Lee, boosting market confidence.
- Current price shows strength, but remains below key moving averages, limiting momentum.

Ethereum emerged from a bullish reversal formation today on rising buy interest and accumulation by institutional investors. The breakout points to a potential change in the near-term trend, though more evidence will be required in future sessions.
At the time of writing, Ethereum (ETH) is trading at $2,156.28 with a 24-hour trading volume of $18.33 billion and a market capitalization of $258.19 billion. The asset has gained 5.82% over the last 24 hours, supported by rising market activity.
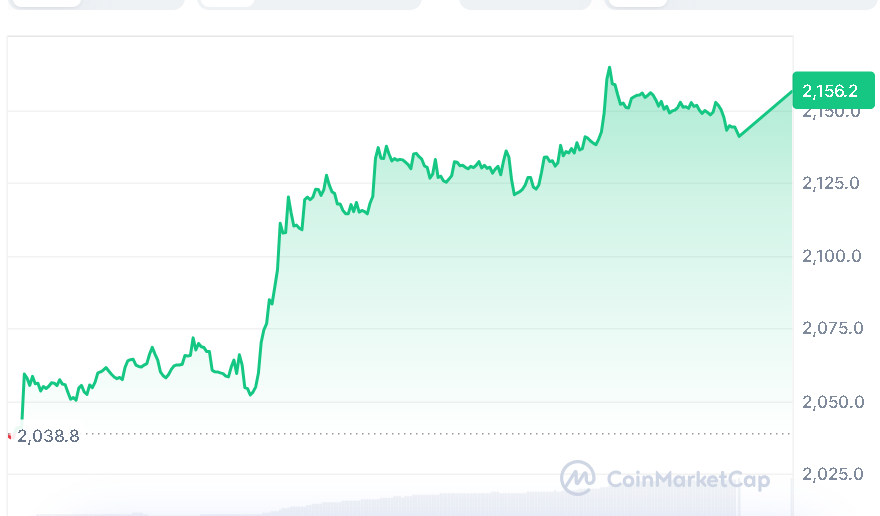
Source: CoinMarketCap

Also Read | Aptos (APT) Breaks Key Resistance: Is a Bullish Rally Toward $3.90 Next?
Ethereum Shows Strength After Breakout
On April 6, 2026, a prominent crypto analyst, BATMAN, stated on X that Ethereum had formed an inverted head and shoulders pattern, which is normally associated with a reversal to the upside.
Despite its development through the 4-hour chart, there is a possibility that this could be a long-term chance provided that the price continues moving higher while remaining above the breakout trendline.
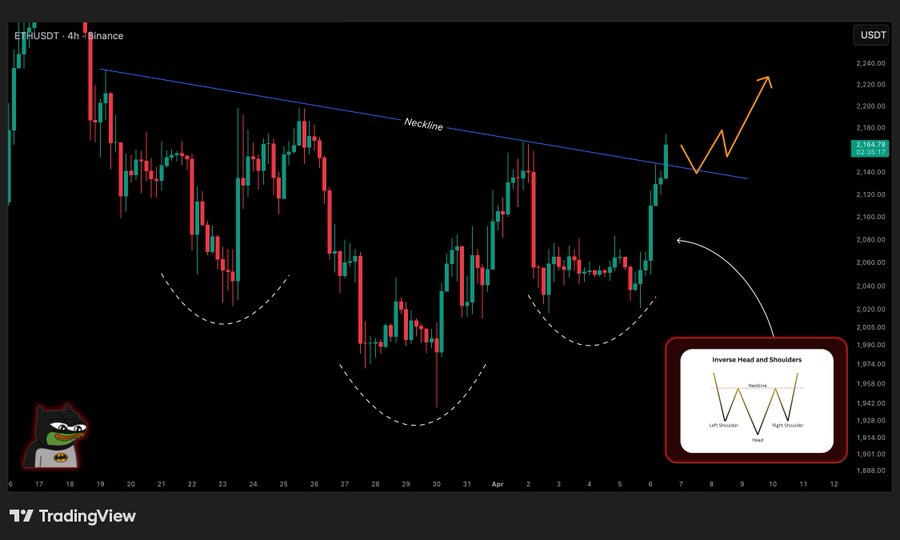
Source: BATMAN’s X Post
Nevertheless, the success of this strategy depends on the ability of Ethereum to retain its current status and garner more buyers in the future.
Ethereum Gains on Institutional Buying
Further to this, it has been noted on the Lookonchain analytics platform that Tom Lee bought an additional 71,252 ETH through Bitmine for a cost of about $152.7 million. At this point, his total Ethereum holding stands at 4,803,334 ETH, amounting to $10.29 billion.
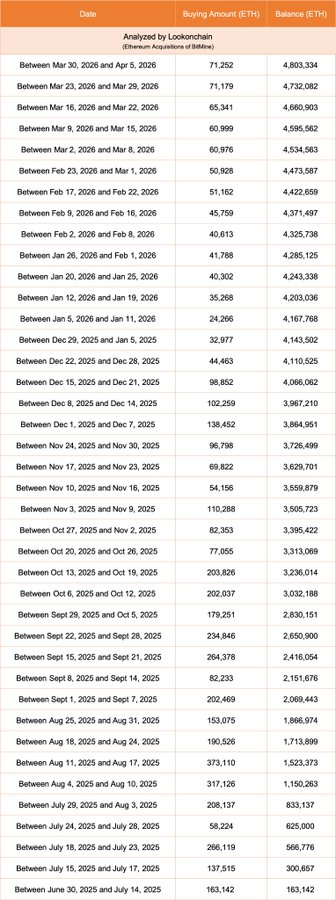
Source: Lookonchain’s X Post
Ethereum Holds Steady but Trend Still Weak
The current value of Ethereum is $2,142 with an RSI value of 54.41, which shows strength, but no significant momentum. The RSI is still higher than its average of 48.49, which reflects a slow recovery.
The price remains beneath critical moving averages, such as the 50-day SMA at $2,406 and the 200-day SMA at $2,981, keeping the overall trend in a bind.
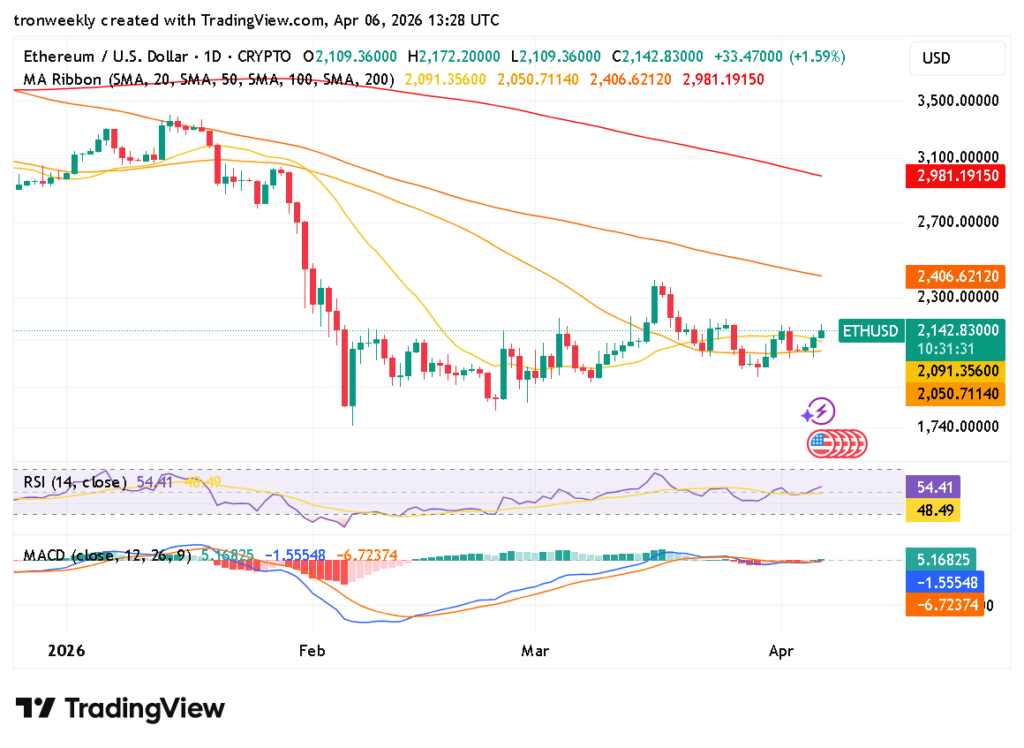
Source: TradingView
The MACD is showing slight positivity as the MACD line at 5.16 is above the signal line at -1.55, indicating a potential bullish crossover. The histogram has not increased significantly, signaling that there is little momentum in the stock.
This shows that buyers are starting to get into action, but further strength is needed for an upward trend to be established.
This article contains market analysis and price predictions. These are not guarantees. Crypto markets are volatile. Always DYOR. Not financial advice.
Also Read | Chainlink (LINK) Range-Bound Trading Signals a Short-Term Rally Toward $9.55

Be the first to comment