


What to know:
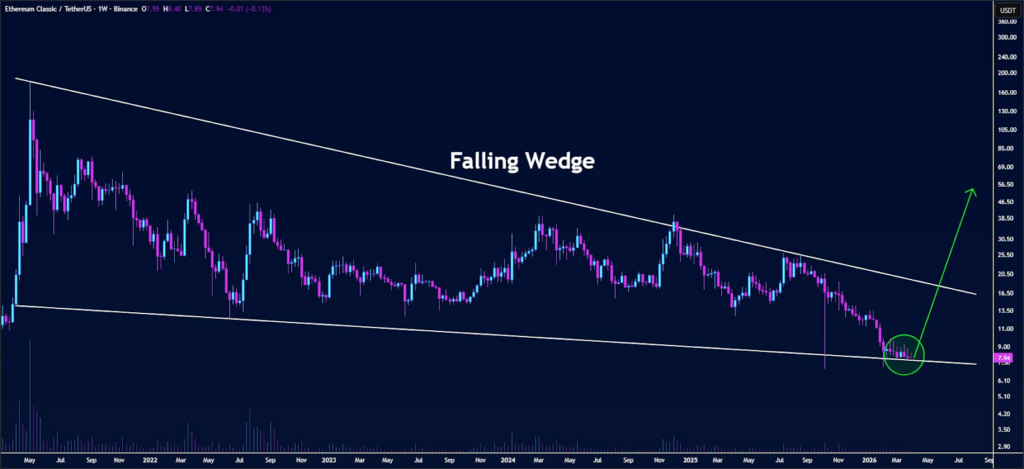
- ETC) is testing the lower boundary of a falling wedge pattern, a structure often linked to potential bullish reversals.
- A breakout above resistance could trigger a strong rally toward the $56.50 level if momentum continues to build.
- The asset remains under bearish pressure, trading below key EMAs with weak momentum indicated by RSI and MACD.

Ethereum Classic (ETC) is testing the lower boundary of its falling wedge on the weekly chart, a technical structure often linked with bullish reversals.
According to the crypto analyst Butterfly, buyers are defending the support zone strongly, absorbing selling pressure and stabilizing price action. Momentum is showing early signs of recovery as traders watch for confirmation of strength across the broader market.
Source: Butterfly’s X Post

Market participants are now eyeing a potential upside breakout if momentum continues building within the wedge structure. A confirmed move above resistance could trigger a strong expansion phase, with analysts projecting a rally toward the $56.50 region.
However, failure to hold support may delay bullish continuation and extend consolidation further in the short-term outlook.
Also Read: Ethereum Classic (ETC) Falling Wedge Point to Possible Rally Toward $78
ETC Technical Outlook Points to Strong Bearish Pressure
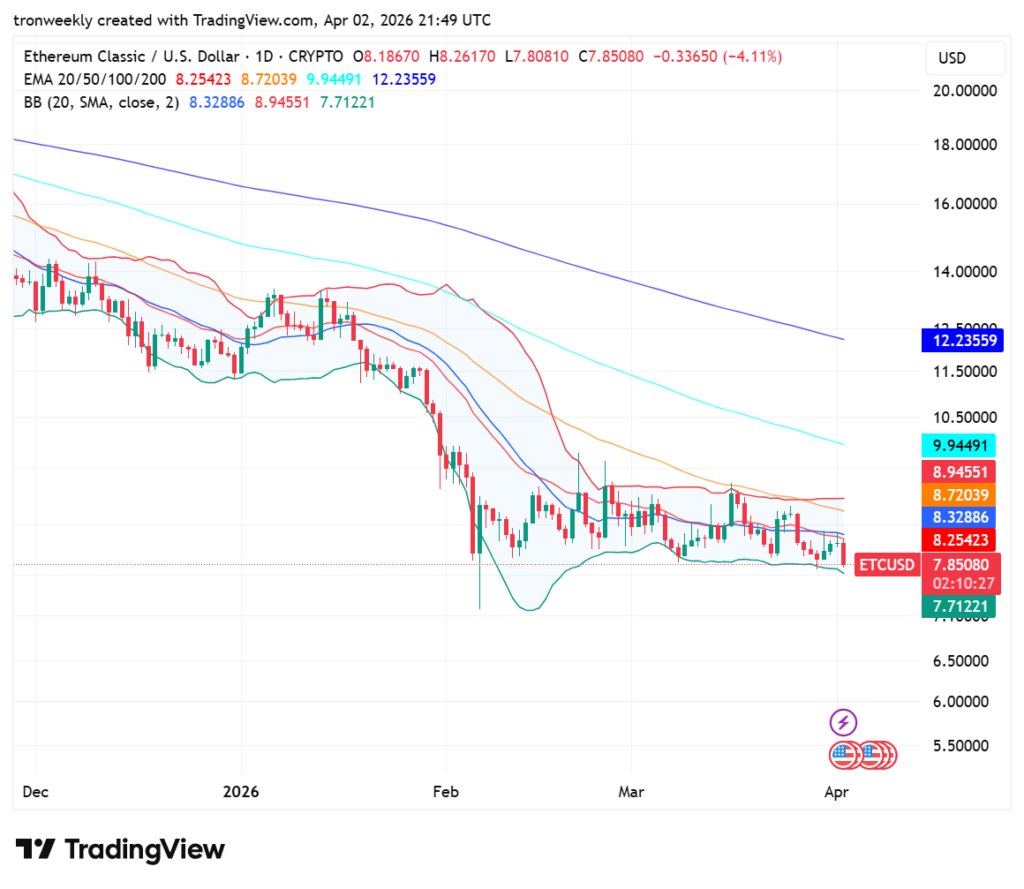
According to TradingView, ETC exhibits a solid bear trend for the beginning months of 2026 as its price continues to be below all the EMAs.
A swift plunge in February brought the price down to just above $7 from around $12.50. Currently, the token is stuck in a narrow band, facing instant resistance at the 20-day EMA while trying to turn bullish.
Source: TradingView
The Bollinger Bands are currently compressed into a range of volatility squeeze, which suggests that a strong movement is coming very soon.
At the moment, the asset price is standing at $7.85, while the lower band restricts its upside potential with the support at $7.71. In addition, the 200-day EMA is located above at $12.23.
Momentum Indicators Reinforce the Bearish Outlook
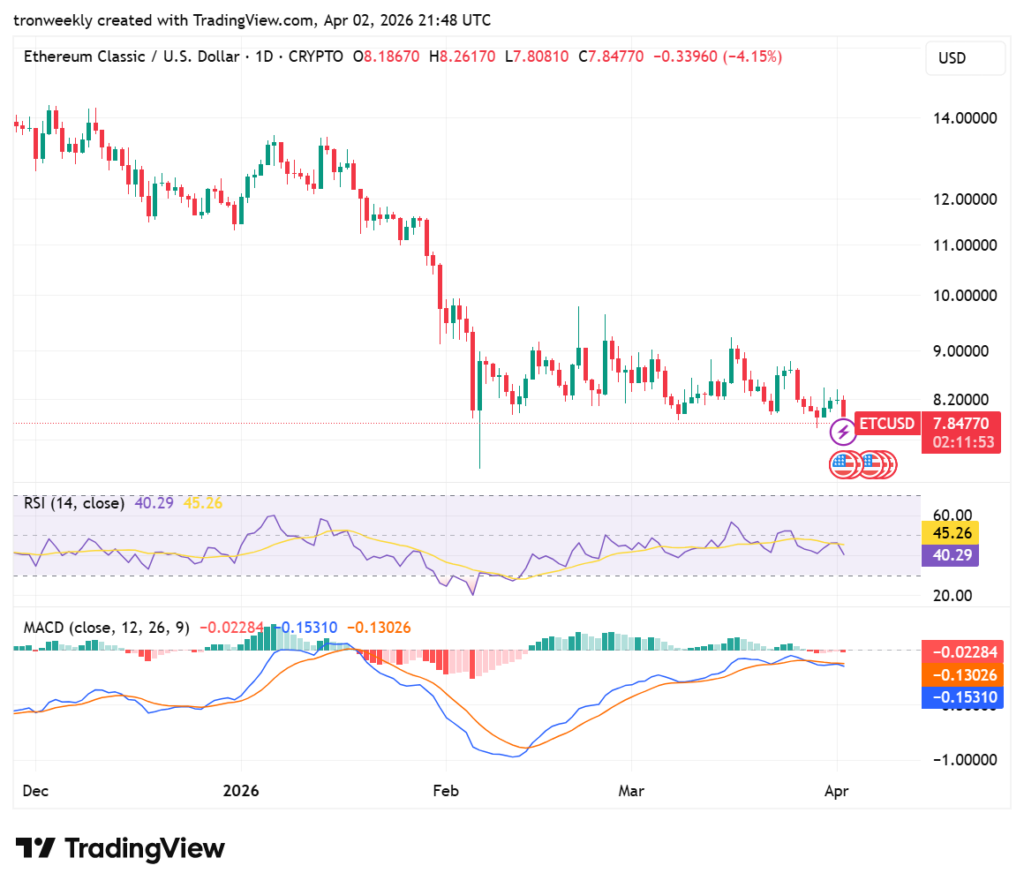
RSI currently stands at 40.29. This is an unweighted position that denotes the weakness of the index. Being slightly below the yellow warning line at 45.26, this indicates that there is weak buying power within the token.
The token has not yet become heavily oversold, but its negative trend suggests that bearish pressure dominates.
Source: TradingView
Further evidence is provided by the MACD indicator, as the two lines remain mostly flat close to the zero level. The MACD line stands at -0.1531, while the signal line is placed at -0.1302; therefore, the distance between them is very small, leading to the formation of a narrow red histogram.
This article contains market analysis and price predictions. These are not guarantees. Crypto markets are volatile. Always DYOR. Not financial advice.
Also Read: Ethereum Classic (ETC) Key Support at $7.96 Could Determine Next Trend

Be the first to comment