


What to know:
- Ethereum dominates tokenized assets, holding 61% market share with $200B on L1.
- ETH faces a corrective phase, trading near $2,350 below major EMAs; $2,580 is critical.
- ETH supply growth is 5x lower than Bitcoin’s, highlighting stronger monetary policy.


Ethereum continues to assert its dominance in the tokenized assets space, capturing 61% of the market with around $200 billion settling on its mainnet.
According to Leon Waidmann, Head of Research at Lisk, the network’s share has been steadily climbing since mid-2024, recovering from a dip to roughly 50% during the multi-chain expansion phase.

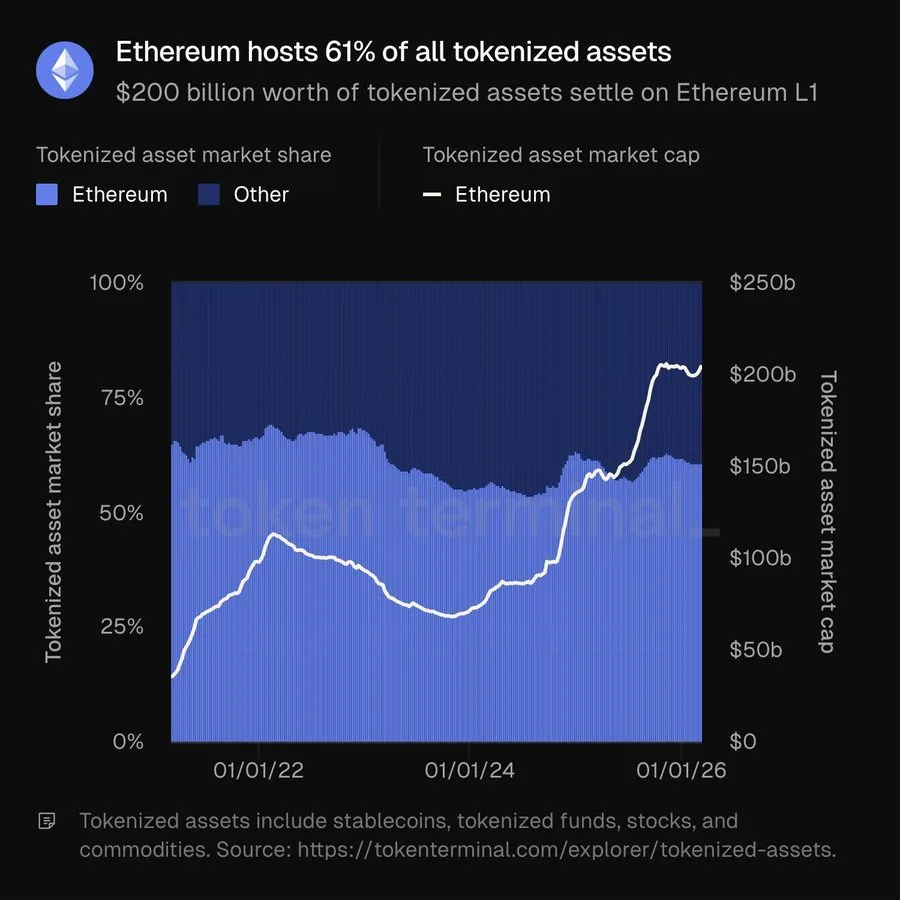

Source: X
The increase is a result of what institutions want. When the value in the real world is represented as tokens, they choose those with the most liquidity, security, and technology behind them, which is what Ethereum has always represented.
This is still the case even in the recent downturn, which indicates that they have faith in the long-term utility of Ethereum as a major layer-1 blockchain for tokenized assets.
ETH Price Faces Corrective Pressure After Bullish Surge
From a technical perspective, ETH is experiencing a pullback following a strong run earlier. On the ETH/USD chart on a weekly scale from TradingView, it is seen that the price of ETH was rejected at the range of $3,700-$3,800, which is acting as moving resistance for the price.
After being rejected from the area, the price of ETH dropped sharply, touching the lower Bollinger Band at around $1,640 before attempting a correction.
Currently, the price of ETH is trading at $2,350. It is currently trading below the 20, 50, and 100-week moving averages. The price is also stuck in a range of about $2,580 and $2,925.
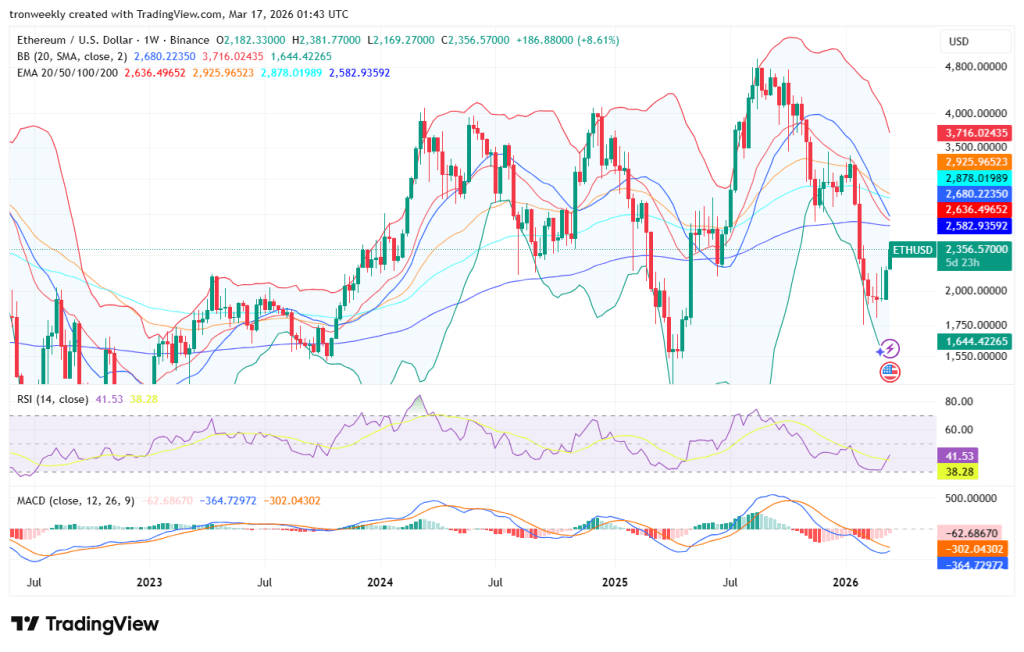
Source: TradingView
The price of ETH needs to trade above the 200-week EMA, which is currently at $2,580. If it is unable to trade above this price, it may remain in a downtrend or a sideways movement. The RSI is currently at about 41, which is a warning sign.
The MACD is also negative, indicating that there is still downward momentum. The price needs to hold above the range of $2,200 and $2,300. If it falls, the next level of support is at about $1,600-$1,700.
Ethereum’s Tighter Monetary Policy
Another interesting aspect of the network’s monetary policy is that, aside from market performance, it is five times less inflationary than Bitcoin, as noted by Waidmann, considering that the Merge occurred three years and 183 days ago.
The growth of the network’s total supply is 0.24%, while Bitcoin’s is 1.25%. This challenges the notion of Bitcoin as “sound money” in the cryptocurrency sphere.
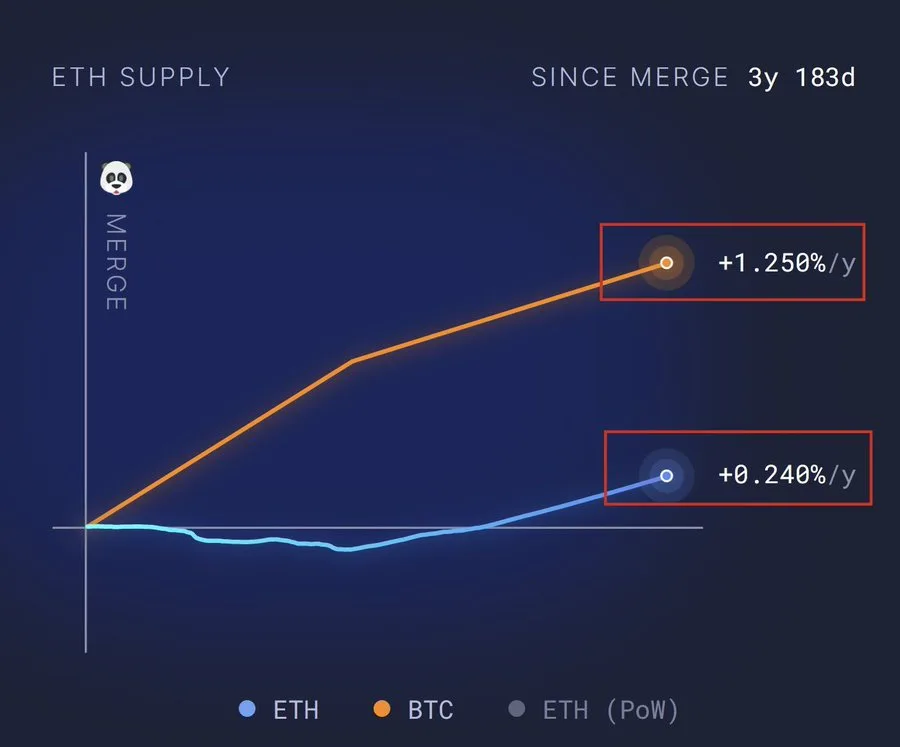

Source: X
On the supply side, Ethereum’s monetary policy is tighter. This helps reduce inflationary pressures and can boost the price of Ethereum in the long term.
Although the price of Ethereum is yet to fully appreciate the reality of this, the figures show the special place of Ethereum in both the asset and monetary landscape.
This article contains market analysis and price predictions. These are not guarantees. Crypto markets are volatile. Always DYOR. Not financial advice.
Also Read: Ethereum Targets Next Growth Phase With Powerful Scaling and ZK-EVM Roadmap

Be the first to comment