


What to know:
- Ethereum leads tokenized assets with 61.4% share and $206B+ in on-chain value, showing strong institutional adoption.
- ETH hovers near a key zone with $1,990 support and $2,040 resistance, defining its short-term direction.
- A break below $1,971 risks further downside, while reclaiming $2,040 could trigger a move higher toward $2,120.

Ethereum continues to dominate the tokenized asset economy, hosting 61.4% of all on-chain tokenized instruments. According to Token Terminal, roughly $206.2 billion in assets currently settle across the Ethereum blockchain, reflecting its deep liquidity and institutional adoption.
Year over year, the market capitalization of tokenized assets on Ethereum has surged more than 40%, highlighting accelerating growth across markets globally.

Source: Token Terminal’s X Post

Competition in tokenized real-world assets is intensifying as alternative Layer 1 networks challenge Ethereum’s lead. Blockchains such as Sui are positioning themselves as scalable, high-performance infrastructure for future financial tokenization.
Experts have now left asking what the market distribution will look like within the next twelve months as capital continues flowing across blockchain ecosystems rapidly.
Also Read: Ethereum Whale Withdraws 9,976 ETH Worth $19.8 Million From Binance
ETH Could Surge to $2120 If Bulls Clear $2040 Level
Apart from this strong network growth, Ethereum (ETH) is at a critical technical inflection point, where $1,990 is a level of support that emerged from a support/resistance flip.
According to the crypto analyst Chiefrat, the momentum trails off, and $2,040 is a level of near-term resistance after the breakdown of the four-hour pattern. The action consolidates into a tight range as it searches for direction.

Source: Chiefrat’s X Post
A reclaim of this $2,040 level could lead to a bullish run towards $2,120, as this level holds existing liquidity.
Falling through $1,990, however, could lead to a bearish bias, opening the door for a run through $1,900 in the coming week. Overall, ETH is currently at a crossroads, and a coming breakout or breakdown will likely dictate its near-future trend.
ETH Technical Outlook Reveals Bearish Pressure
According to TradingView, Ethereum’s weekly chart is indicating a bearish trend, trading around the $2,000 mark. Ethereum is trading in the middle and lower Bollinger Bands, indicating bearish momentum.
The 20-week simple moving average is trading at $2,585, acting as a resistance for Ethereum. A fall in price below $1,971 could send Ethereum to the support of $1,573.
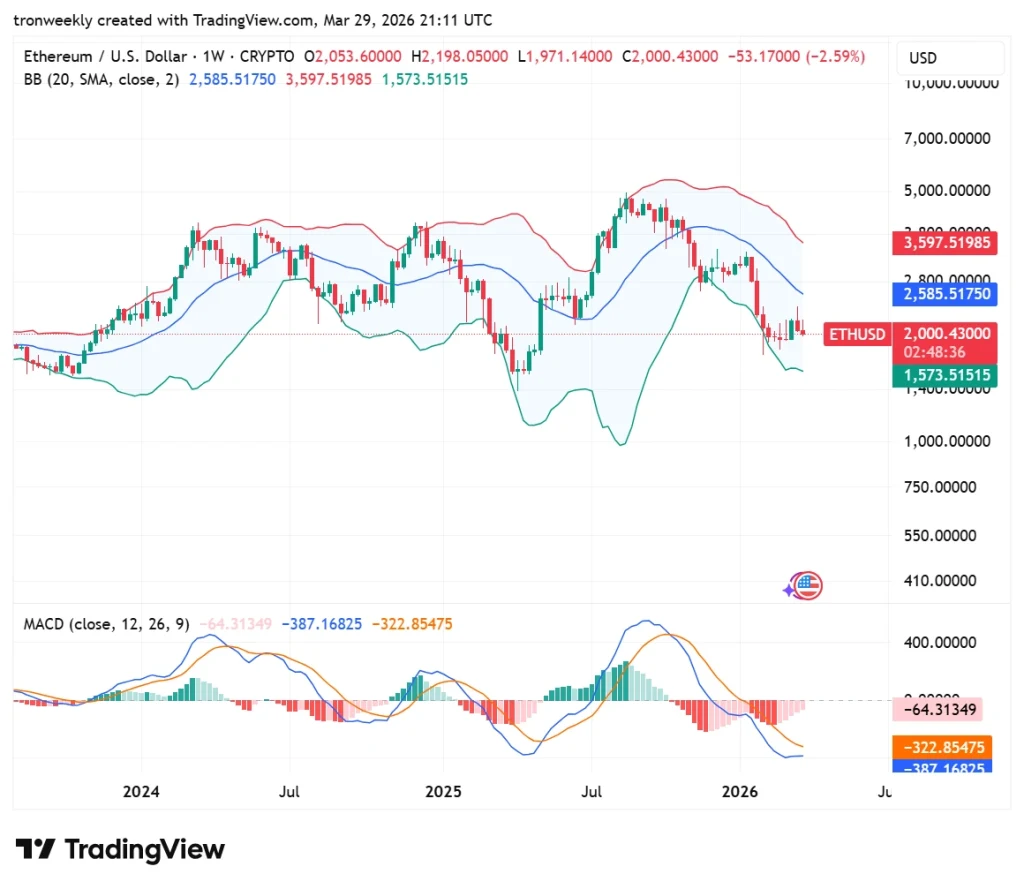
Source: TradingView
The technical indicators also support this bleak outlook, as the MACD line plunges significantly below its signal counterpart. The red bars on the histogram have just started to shorten, but there is no bullish crossover yet.
Watch out for a daily close above the middle Bollinger Band as a sign to turn around. Until then, the market’s inherent bias remains firmly in place.
This article contains market analysis and price predictions. These are not guarantees. Crypto markets are volatile. Always DYOR. Not financial advice.
Also Read: Ethereum Struggles Around $2,000 as Selling Pressure Threatens $2,100-$2,150 Zone

Be the first to comment