


What to know:
- Ethereum holds above $2,260 with weekly gains despite a sharp drop in trading volume.
- The Elliott Wave model places ETH in a correction phase with a $1,700–$1,200 support range.
- Derivatives weaken as open interest dips and funding turns negative, signaling cautious bias.

Ethereum (ETH) trades near $2,260.90, posting a 0.57% daily gain. Data shows mixed signals as price edged higher while activity slowed. Weekly performance remained positive, indicating steady demand despite weaker participation across spot and derivatives segments.
According to CoinMarketCap data, Ethereum (ETH) recorded a 45.88% drop in trading volume, now at $10.03 billion. Over the last seven days, the asset gained 9.93%. The data reflects continued price support despite a notable decline in trading activity.
Also Read: Ethereum Gains 2.26% as Key $1,550 and $1,070 Support Zones Come Into Focus

Ethereum Faces Key Fibonacci Support
A well-known analyst, Crypto Patel, highlighted a long-term Elliott Wave structure for Ethereum. The first phase, labeled Wave (1), spanned from 2015 to 2021. It completed a five-wave impulse move and reached a peak near $4,800.
The second phase, identified as Wave (2), is now taking place. It involves an extended ABC correction pattern. In the third wave, the objective price is estimated to reach a range of $1,700 – $1,200.
The targeted price range falls within the previous Wave 4 formation. At the same time, it reflects Fibonacci retracements of waves (1) between 0.618 and 0.786. These ratios are frequently monitored for support in corrections.


In terms of timeframe, the next phase is projected to take place between 2026 and 2029. The start of this cycle can involve an accumulation and structural reset phase. Subsequently, a powerful third wave might emerge, followed by a weak wave (4).
Finally, there comes Wave (5). The expected target price range will be between $15,000 and $20,000. This estimate is made using the Fibonacci projections of the preceding impulse structure.
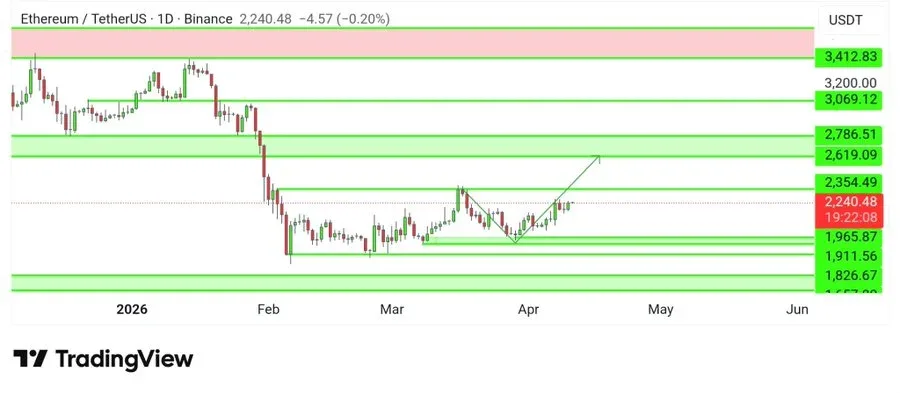
ETH Maintains Structure Above Demand Zone
In the short-term, the analyst saw stability in the price action. Another analyst, Crypto Candy, revealed that Ethereum has a demand zone in the price action ranging from $1,970 to $1,900. The asset’s price touched the $2,300 region, getting near to its predicted target.
For continuation of the same momentum, the next possible price action is anticipated to be between $2,600 and $2,700. However, the structure is valid only if the price is above the demand zone.

Open Interest Drops as Bearish Bias Emerges
Derivatives data shows reduced participation during this period. According to CoinGlass data, there is a decline in the open interest by 0.87% to $31.96 billion. The trading volume also decreased by 53.23%, reaching a value of $23.05 billion.
The OI-weighted funding rate is recorded at -0.0030%. The negative number shows a bearish inclination among the leverage traders.
This article contains market analysis and price predictions. These are not guarantees. Crypto markets are volatile. Always DYOR. Not financial advice.
Also Read: Bitcoin Holds Steady as Weak Momentum Signals Potential $56K–$60K Support Retest

Be the first to comment